Details of modeling types are discussed in the Basic Analysis book. The details of fitting appear in the appendix Statistical Details. The method is discussed in Walker and Duncan (1967), Nelson (1976), Harrell (1986), and McCullagh and Nelder (1983).
|
1.
|
|
2.
|
Select Analyze > Fit Model.
|
|
3.
|
|
4.
|
|
5.
|
|
6.
|
Click Run.
|
|
7.
|
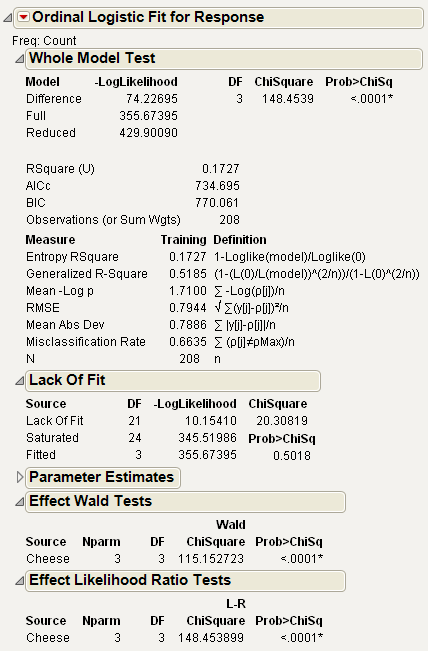
The model in this example reduces the –LogLikelihood of 429.9 to 355.67. This reduction yields a likelihood-ratio Chi-square for the whole model of 148.45 with 3 degrees of freedom, showing the difference in perceived cheese taste to be highly significant.
The Lack of Fit test happens to be testing the ordinal response model compared to the nominal model. This is because the model is saturated if the response is treated as nominal rather than ordinal, giving 21 additional parameters, which is the Lack of Fit degrees of freedom. The nonsignificance of Lack of Fit leads one to believe that the ordinal model is reasonable.
To see whether a cheese additive is preferred, look for the most negative values of the parameters (Cheese D’s effect is the negative sum of the others, shown in Parameter Estimates and Preferences for Cheese Additives in Cheese.jmp.).
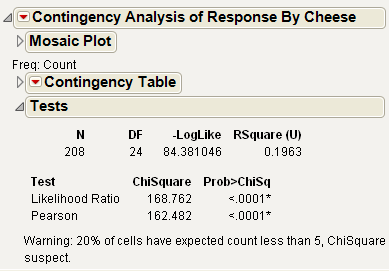
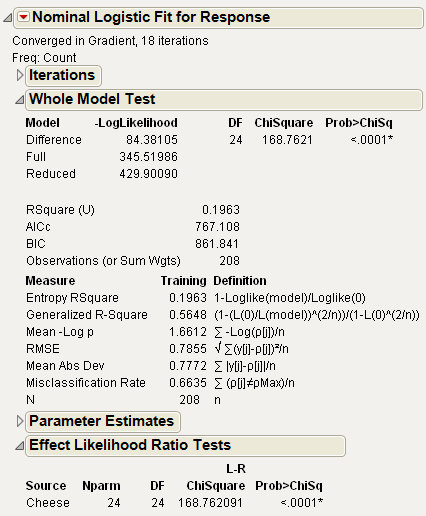
You can also use the Fit Y by X platform for this model, which treats ordinal responses like nominal and shows a contingency table analysis. See Fit Y by X Platform Results for Cheese.jmp. The Fit Model platform can also be used, but you must change the ordinal response, Response, to nominal. See Fit Model Platform Results Setting Response to Nominal for Cheese.jmp. Nominal Fit Model results are shown in Fit Model Platform Results Setting Response to Nominal for Cheese.jmp. Note that the negative log-likelihood values (84.381) and the likelihood chi-square values (168.76) are the same.
Fit Y by X Platform Results for Cheese.jmp
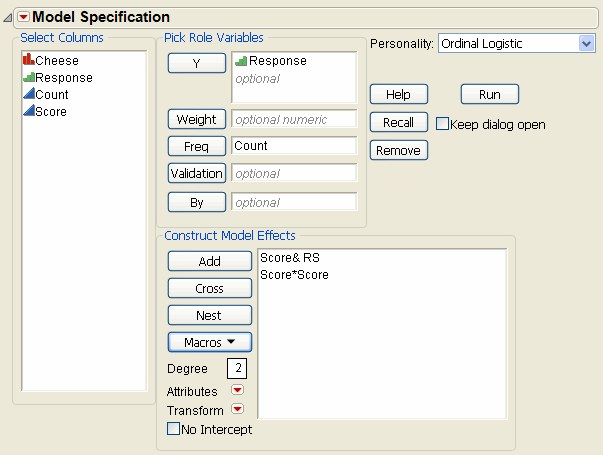
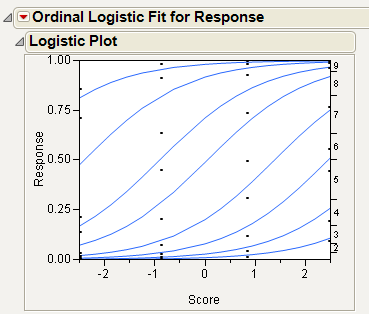
If you want to see a graph of the response probabilities as a function of the parameter estimates for the four cheeses, add the Score variable as a response surface effect to the Fit Model dialog as shown. To create the model in Model Dialog For Ordinal Logistic Regression, select Score in the column selector list, and then select Response Surface from the Macros popup menu on the Fit Model dialog.
Click Run to see the analysis report and the cumulative logistic probability plot in Cumulative Probability Plot for Ordinal Logistic Regression. The distance between each curve is the fitted response probability for the levels in the order for the levels on the right axis of the plot.
