Content Organization
Stay organized. Provide transparency. Build consensus.
- Translate statistical results to a simplified view of your project to communicate findings to decision makers in an approachable way.
- Empower decision makers to see into the black box, rather than simply trusting it.
- Organize, summarize, and document content to better aid the accountability and reproducibility of your work.
The projects feature in JMP makes it easy to document complex processes—it's a real game-changer."
Alfredo López Navarro
Knowledge Manager, Telefónica
Dashboards
- Combine windows
- Filters
Reporting
- Save report
- Save JMP journal
- Save to PowerPoint
JMP Live (separate product)
- Hierarchical folders
- Data refresh
- Spaces
Applications
Projects

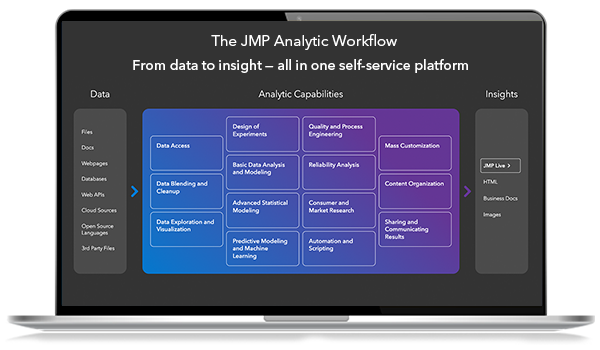
JMP® Analytic Capabilities
See everything that JMP® can do for you and your organization, from data access and cleaning, to exploration and visualization, all the way through sharing and communicating your results.
