Cluster Subjects Across Study Sites
This report is used to identify similar subjects within a demographic subgroup, such as Sex = F and Race = Asian. It does so by constructing a cross domain dataset using as much baseline data as possible (subject to user options). The dataset includes age and the variables from available findings domains (LB, EG, VS, etc.) with less than 5% missing values. Next, for each demographic subgroup, it calculates Euclidean distances to compute a distance matrix and performs hierarchical clustering of subjects, across all of the study sites. Findings values are averaged by USUBJID, test code, visit number, and time point (if available) if there are multiple measurements for a visit or time point. The goal of this exercise is to identify pairs of subjects with a very small distance. This could be an indication that these subjects are in fact the same individual who has enrolled at multiple sites.
Report Results Description
Running this report using the Nicardipine sample setting and default options generates the output shown below. This report uses pre-dosing information with the goal of identifying subjects that have enrolled at two or more clinical sites.
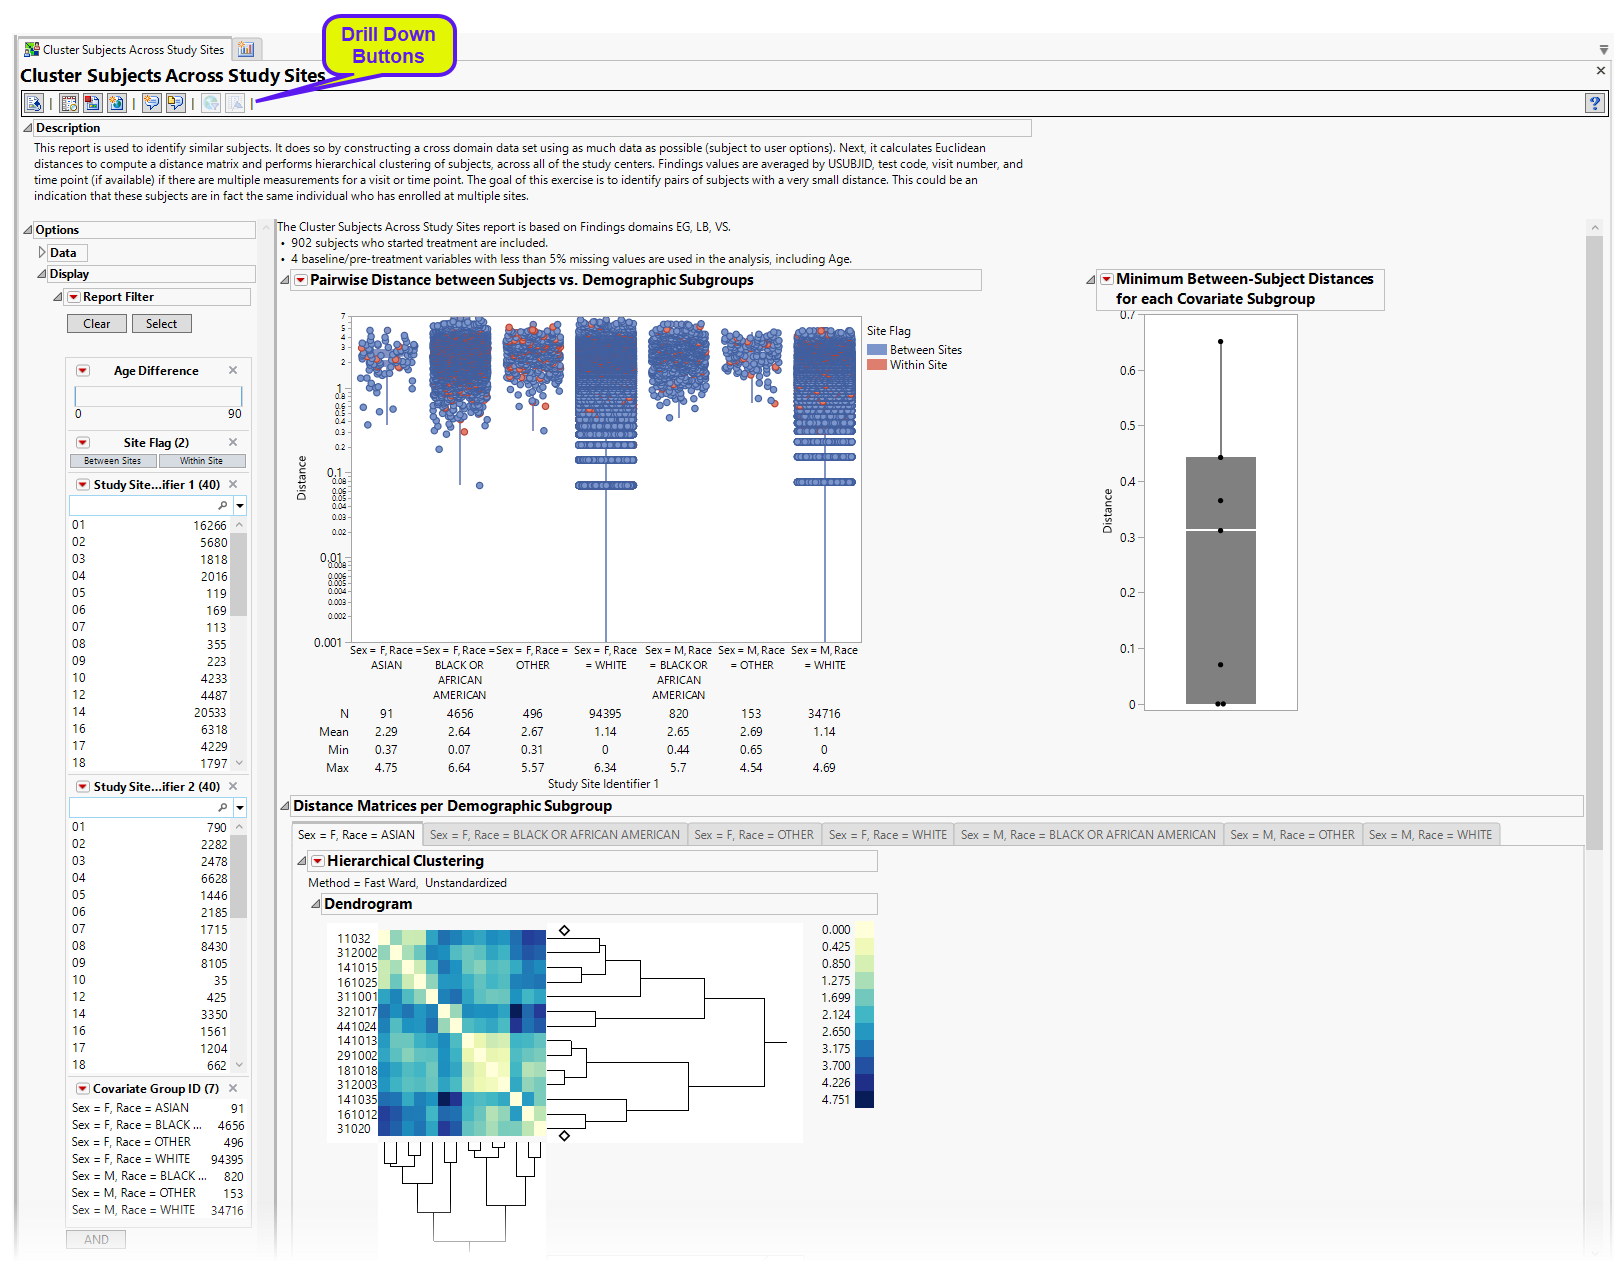
The Cluster Subjects Across Study Sites report shows the results of clustering of the subjects on the basis of different combinations of covariates (demographic subgroups in this example). The results for each grouping are presented on a separate “section”. This report initially shows two sections Between-Subject Distance Summary and Subgroup Clustering. Use the available options in each section to drill-down into the data.
Between-Subject Distance Summary
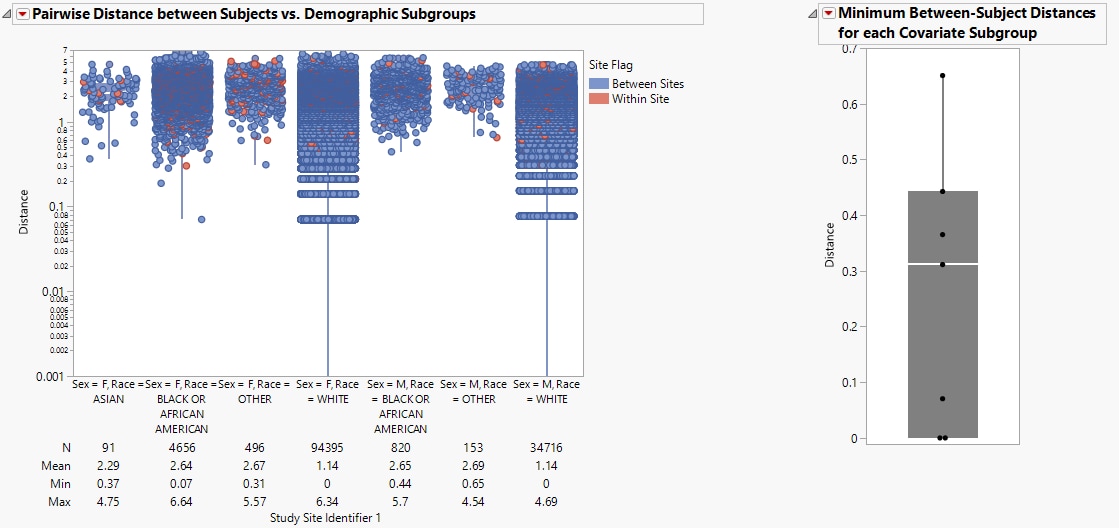
| • | Box plots are presented for all pairwise distances between subjects in the selected population. Individual points are overlaid with the box plot, with the colors differentiating 'Between Sites' and 'Within Site' distances. The Y-axis is set to log-scale by default for the ease of identifying small distance points when the range of distance is large. A summary table is shown below the boxplot presenting the N, Mean, Min, Max values for each covariate group. |
In this example, box plots are presented by gender and race. The more similar a pair of subjects, the smaller the distance value (a zero indicates a perfect match). Note that when using the log-scale, the zero values are not presented in the graph (e.g. Sex=F, Race=WHITE and Sex=M, Race=WHITE), but can be observed in the statistics summary table.
| • | One Box Plot of Minimum Between-Subject Distances for Each Site. The minimum distance from each covariate subgroup is presented in the box plot to the right. |
The subgroup with the most similar pair of subjects is presented in the Subgroup Clustering section.
Subgroup Clustering
One or more Subgroup Clustering sections: The Hierarchical clustering results for each demographic subgroup are presented in different panels. The name of a panelis dependent on the covariate values used.
The Sex = F, Race =ASIAN subgroup clustering section is shown below:
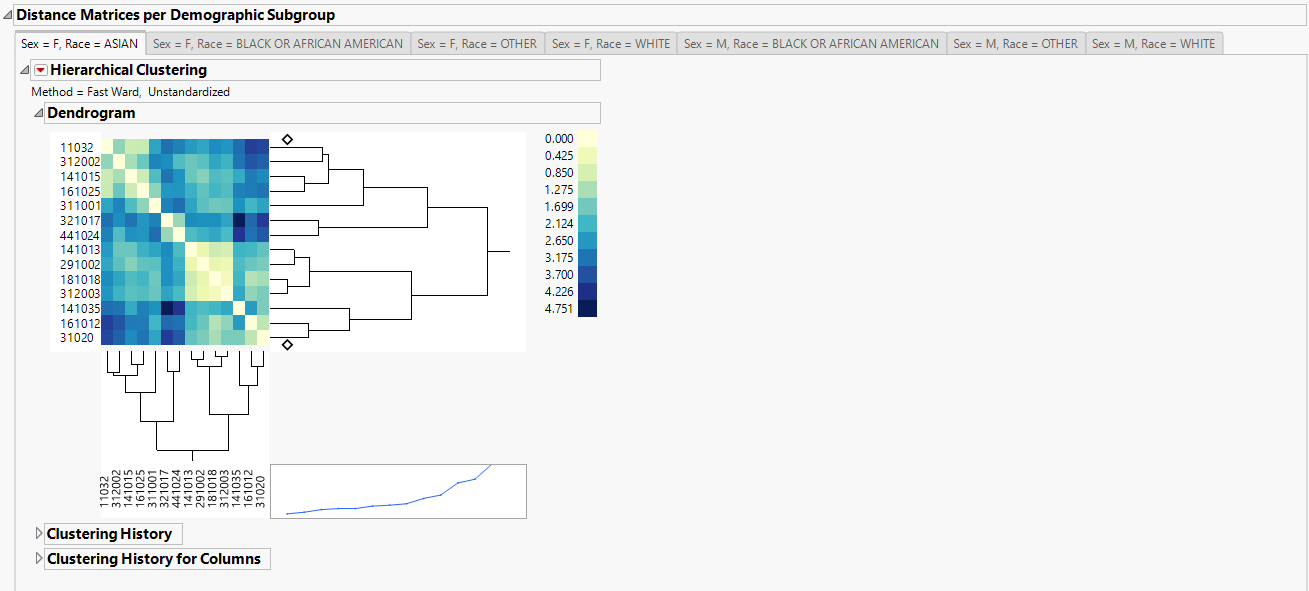
| • | A heatmap with subject IDs being rows and columns annotations. The legend shows the pairwise distance values with a minimum of zero. All the pairwise distance matrices, along with the subjects' ID , study sites and treatment arms, are stored in separate jmp tables, and can be accessed by clicking the 'View Tables' button. |
Options
Data
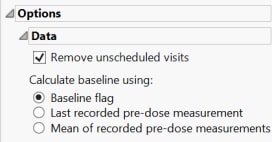
Remove unscheduled visits
You might or might not want to include unscheduled visits when you are analyzing findings by visit. Check the Remove unscheduled visits to exclude unscheduled visits.
Calculate baseline using:
Use the Calculate baseline as: widget to use one of the following: i) baseline flag variable, ii) the last recorded pre-dose measurement, or iii) the mean of all the measurements taken during the baseline time window as the baseline measurement.
Display
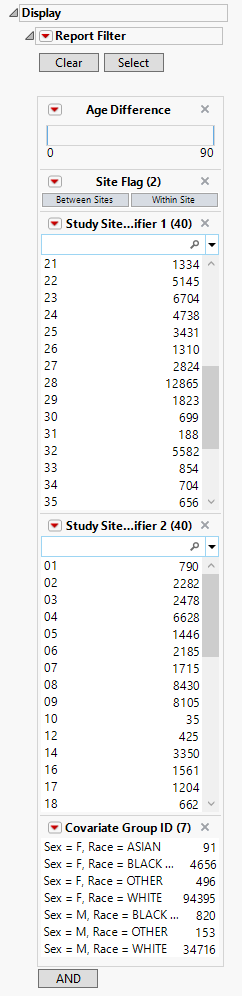
Report Filter
These filters enable you to subset and view subjects based on demographic characteristics (Age Difference, Site Flag), study sites (Site IDs for the two subjects in the pairwise comparison), and other criteria (covariate ID). Refer to Data Filter for more information.
Refer to the Data Filter documentation for more information
General and Drill Down Buttons
Action buttons, provide you with an easy way to drill down into your data. The following action buttons are generated by this report:
| • | Click  to rerun the report using default settings. to rerun the report using default settings. |
| • | Click  to view the associated data tables. Refer to Show Tables/View Data for more information. to view the associated data tables. Refer to Show Tables/View Data for more information. |
| • | Click  to generate a standardized pdf- or rtf-formatted report containing the plots and charts of selected sections. to generate a standardized pdf- or rtf-formatted report containing the plots and charts of selected sections. |
| • | Click  to generate a JMP Live report. Refer to Create Live Report for more information. to generate a JMP Live report. Refer to Create Live Report for more information. |
| • | Click  to take notes, and store them in a central location. Refer to Add Notes for more information. to take notes, and store them in a central location. Refer to Add Notes for more information. |
| • | Click  to read user-generated notes. Refer to View Notes for more information. to read user-generated notes. Refer to View Notes for more information. |
| • | Click  to open and view the Review Subject Filter. to open and view the Review Subject Filter. |
| • | Click  to specify Derived Population Flags that enable you to divided the subject population into two distinct groups based on whether they meet very specific criteria. to specify Derived Population Flags that enable you to divided the subject population into two distinct groups based on whether they meet very specific criteria. |
Default Settings
Refer to Set Study Preferences for default Subject Level settings.
Methodology
No testing is performed. Subjects are clustered within each site according to the selected clustering methodology. See statistical details for hierarchical clustering in the JMP documentation.