Study Flow Diagram
This report generates a flow diagram, based on the CONSORT (CONsolidated Standards of Reporting Trials) 2010 guideline1, to summarize the overall clinical trial data flow.
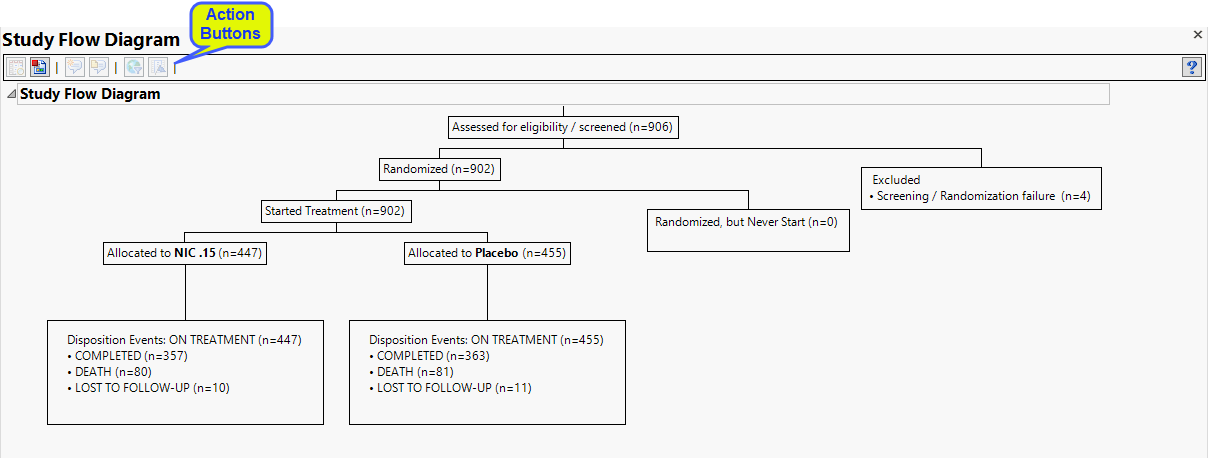
The diagram, generated from the Nicardipine study, starts with 906 subjects initially assessed for eligibility. Four subjects failed preliminary screening and were dropped from the study. The 902 remaining subjects were randomized and divided into two groups: 447 subjects in the treatment group (NIC. 15) and 455 subjects in the placebo group. Treatment and placebo groups have similar disposition events: Completed (357 and 363); death (80 and 81) and lost to follow-up (10 and 11).
Data from both the DM and DS domains were used to generate this diagram. The default population and treatment variable from "Set Study Preferences" are used in this report.
Note: The CDISC variable DSDECOD is primarily used to calculate the number of disposition events per subgroup of interest.
Note: This report can generate subcategory boxes for Disposition Events if DS.EPOCH exists or DS.DSSCAT exists.
Note: This report can also extract information from the EX and ADSL domains.
Note: When a study contains EPOCHs, any disposition boxes (specified by DSSCAT) for each EPOCH are shown on the same level. Disposition subcategories are shown below this level. When no EPOCH exists, but DSSCAT does exist, disposition subcategories are shown as Disposition event boxes. If DSSCAT does not exist, disposition event boxes are shown for each treatment arm disposition events are considered ON-TREATMENT
Action Buttons
| • | Click  to view the associated data tables. Refer to Show Tables/View Data for more information. to view the associated data tables. Refer to Show Tables/View Data for more information. |
| • | Click  to generate a standardized pdf- or rtf-formatted report containing the plots and charts of selected sections. to generate a standardized pdf- or rtf-formatted report containing the plots and charts of selected sections. |
| • | Click  to generate a JMP Live report. Refer to Create Live Report for more information. to generate a JMP Live report. Refer to Create Live Report for more information. |
| • | Click to generate a JMP Live report. Refer to Create Live Report for more information. |
| • | Click  to take notes, and store them in a central location. Refer to Add Notes for more information. to take notes, and store them in a central location. Refer to Add Notes for more information. |
| • | Click  to read user-generated notes. Refer to View Notes for more information. to read user-generated notes. Refer to View Notes for more information. |
Note: A wide diagram can be truncated in an rtf static report. To view the entire diagram in MS Word, Select View > Web Layout.