Adverse Events Time to Event
This report displays the cumulative incidence of adverse events leading to discontinuation of study treatment.
Report Results Description
Running this report with the Nicardipine sample setting generates the tabbed Results shown below.
This report presents a plot and several tables.
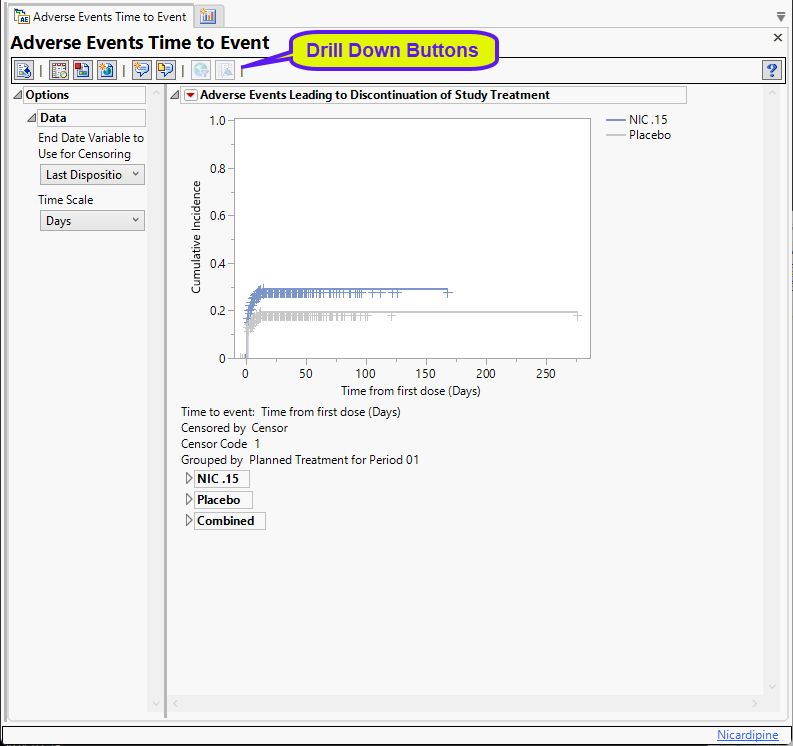
Cumulative Incidence Plot
This plot shows the cumulative incidence of adverse events over the time elapsed from the first treatment dose. Examination of this plot enables one to see when the events occurred and gives an accurate estimate of the incidence by treatment group. Subjects are censored at the date of the last disposition record unless another date is chosen.
Tables
Tables provide basic statistics for each treatment group and for the overall study. The table below shows the results for the Nicardipine treatment group.
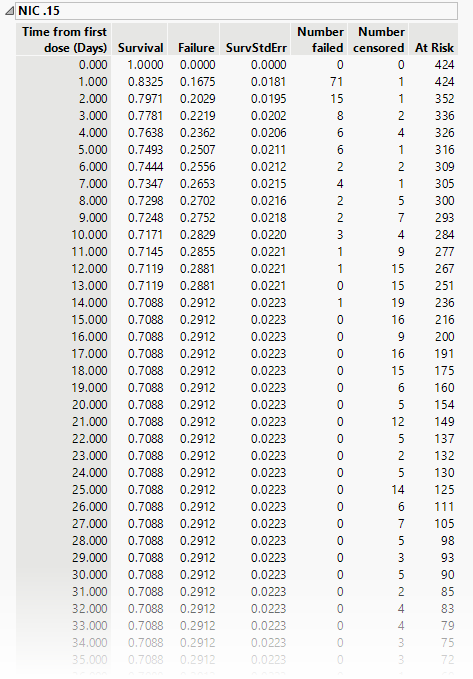
The tables list time from the first dose and, at each time point, both survival in the trial and failure to continue, absolute number failed or censored and the number remaining at risk.
Options
Data
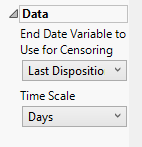
End Date Variable to Use for Censoring
Use the End Date Variable to Use for Censoring option for specifying the end date for censoring. Options include the reference end date, date of the last treatment, or the date of the last disposition record (selected by default).
Time Scale
Use this widget to specify the time scale to use for times. Options include Hours, Days, Weeks, Months, and Years. Refer to Time Scale for more information
General and Drill Down Buttons
Action buttons, provide you with an easy way to drill down into your data. The following action buttons are generated by this report:
| • | Click  to rerun the report using default settings. to rerun the report using default settings. |
| • | Click  to view the associated data tables. Refer to Show Tables/View Data for more information. to view the associated data tables. Refer to Show Tables/View Data for more information. |
| • | Click  to generate a standardized pdf- or rtf-formatted report containing the plots and charts of selected sections. to generate a standardized pdf- or rtf-formatted report containing the plots and charts of selected sections. |
| • | Click  to generate a JMP Live report. Refer to Create Live Report for more information. to generate a JMP Live report. Refer to Create Live Report for more information. |
| • | Click  to take notes, and store them in a central location. Refer to Add Notes for more information. to take notes, and store them in a central location. Refer to Add Notes for more information. |
| • | Click  to read user-generated notes. Refer to View Notes for more information. to read user-generated notes. Refer to View Notes for more information. |
| • | Click  to open and view the Review Subject Filter. to open and view the Review Subject Filter. |
| • | Click  to specify Derived Population Flags that enable you to divided the subject population into two distinct groups based on whether they meet very specific criteria. to specify Derived Population Flags that enable you to divided the subject population into two distinct groups based on whether they meet very specific criteria. |
Note: For information about how treatment emergent adverse events (TEAEs) are defined in JMP Clinical, please refer to How does JMP Clinical determine whether an Event Is a Treatment Emergent Adverse Event?.
Default Settings
Refer to Set Study Preferences for default Subject Level settings.
Methodology
Adverse events leading to treatment discontinuation are determined from the adverse event dataset where the action taken variable (AEACN) contains "Withdrawn". If there are multiple treatments administered, then all action taken variables are scanned for at least one containing "Withdrawn". Subjects with missing censor date information are removed from the analysis. Notes are displayed at the top of the report for what censor date variable is used and how many subjects were removed due to missing censor date information.