Drug-induced Liver Injury
This report assesses the results of multiple lab tests enabling you to determine whether trial subjects have sustained drug-induced liver damage. Analysis results are presented and summarized in multiple graphs and tables.
Report Results Description
Running this report with the Nicardipine sample setting generates the report shown below.
The Report contains the following elements:
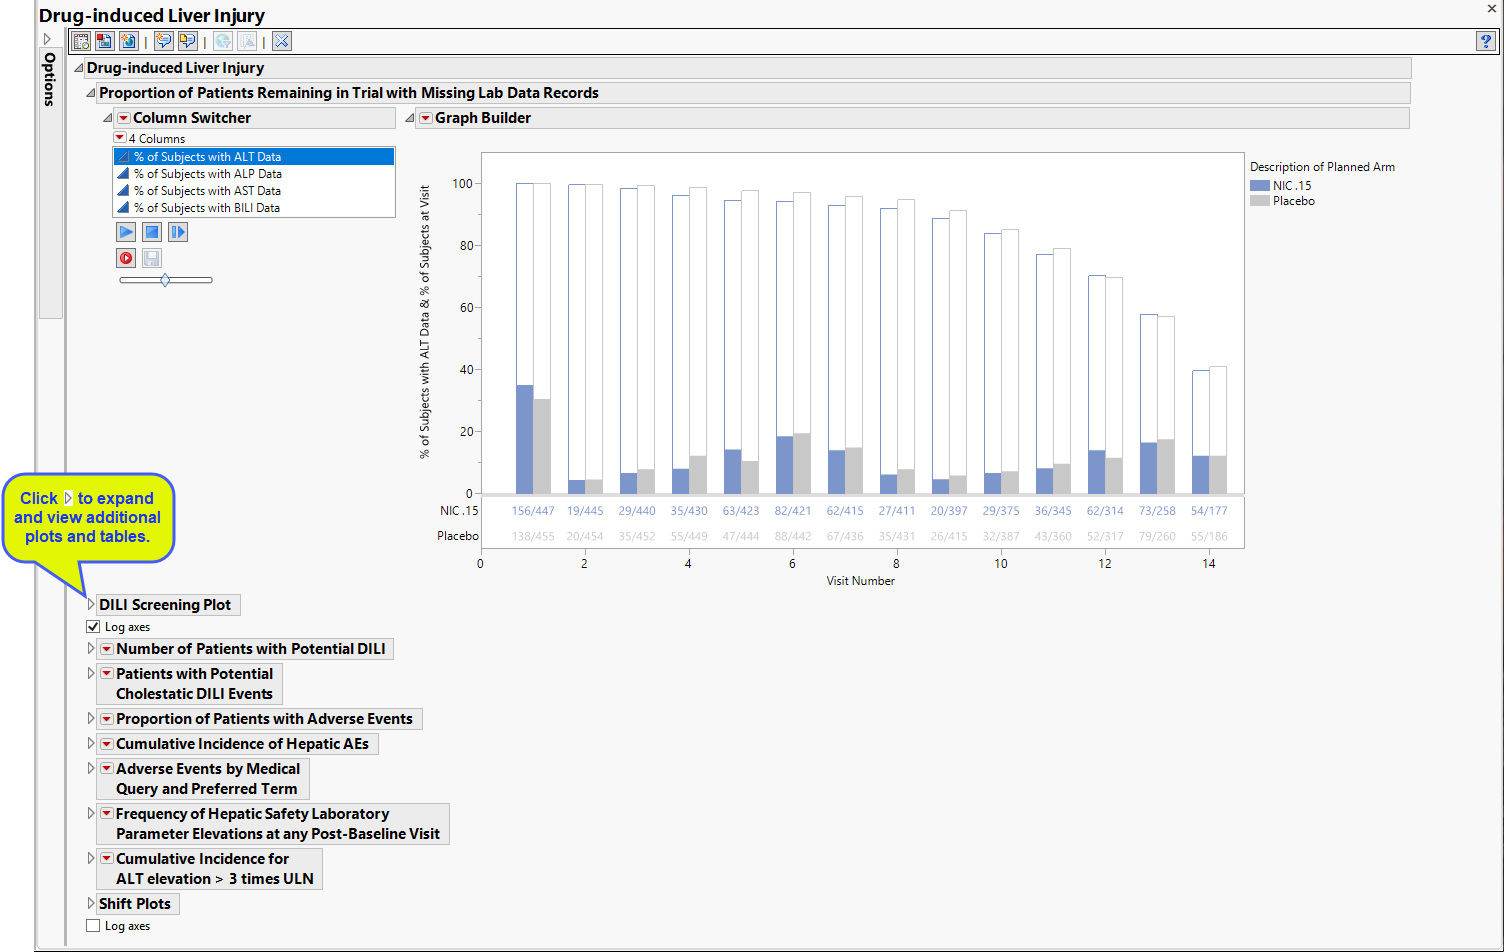
Proportion of Patients Remaining in Trial with Missing Lab Data Records
Contains 4 stacked Bar Charts showing the percent of subjects at each visit who either had relevant labs (filled bars) or were missing those tests (unfilled bars).
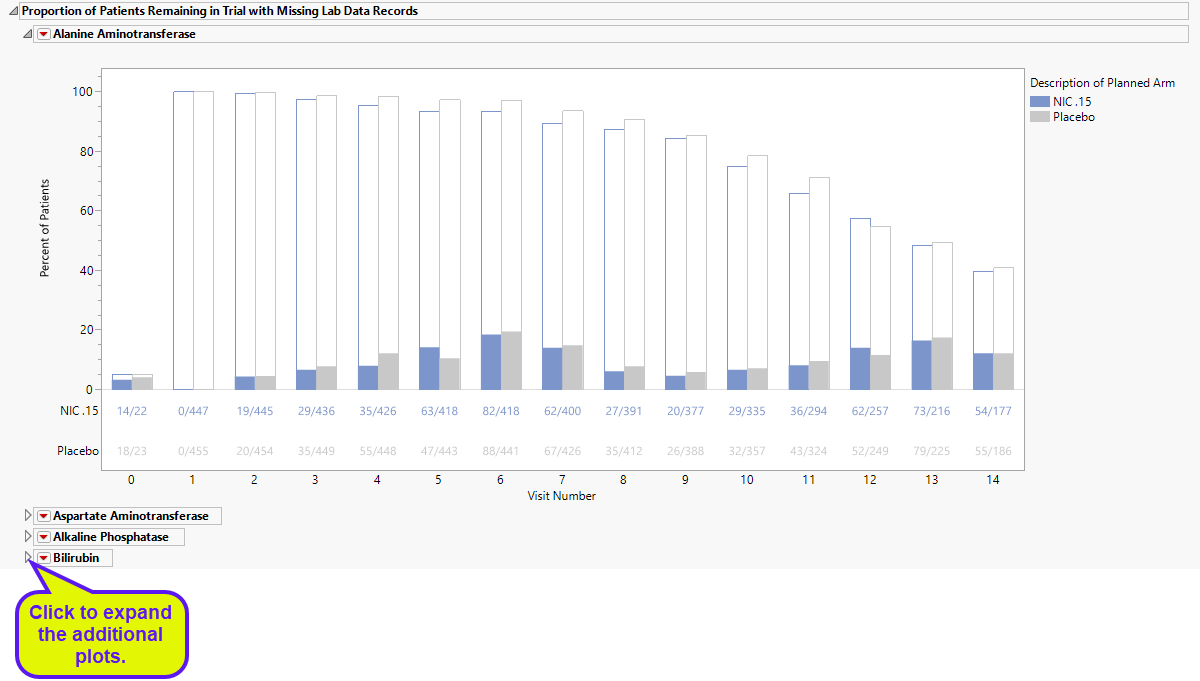
Four different plots are displayed: one each, with and without test data, for alanine aminotransferase (ALT), alkaline phosphatase (ALP), aspartate aminotransferase (AST), or bikirubin (BILI). Subjects are colored by treatment group.
The percentage of subjects with test data at each visit is shown by the filled bars. The relative number for this group is shown below the plot. There is a separate bar for each treatment arm. The percentage of subjects missing the test data is shown by the empty bar stack atop the filled bar. The total height of the stacked bar pair indicates the percentage of subjects for each arm present at the visit.
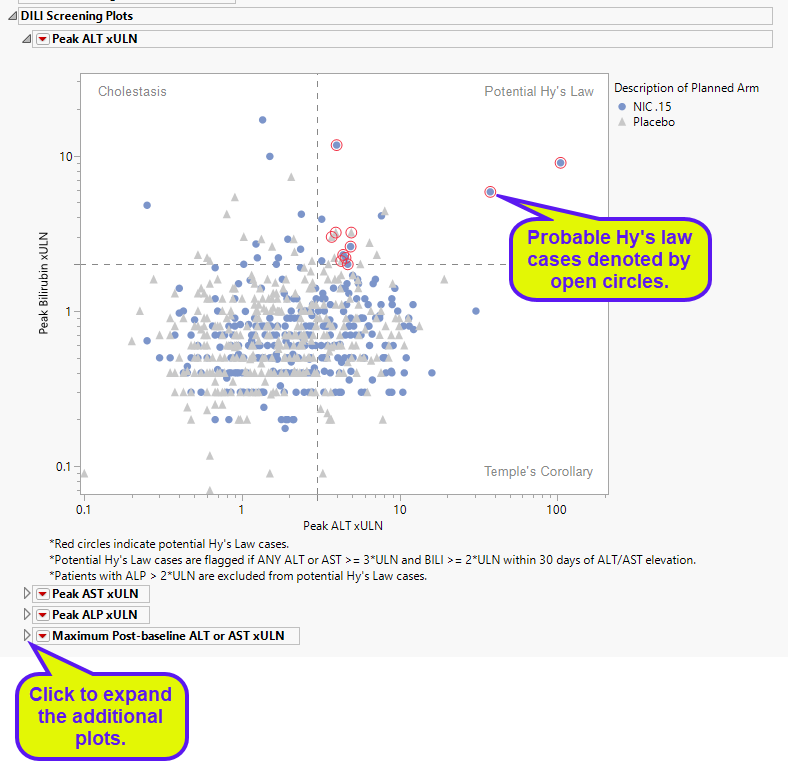
DILI Screening Plot
Displays an overall scatter plot of peak ALT, AST , BILI, and ALP measurements across the study, with color used to indicate treatment arm.
The Peak Liver Test Results section consists of the following elements:
| • | One Overlay Plot of Hy's Law Lab Tests. |
This plot shows maximum laboratory values for the Alanine Aminotransferase (ALT), laboratory test , Aspartate Aminotransferase (AST) and Alkaline Phosphatase (ALP) laboratory tests (x-axis). The maximum laboratory values for the test for Total Bilirubin (BILI) is always shown on the y-axis. The values are log10 and normalized by the Upper Limit of Normal (LBSTNRHI) (with the option to normalize by baseline values). Subjects are colored and marked by treatment arm. Reference lines are drawn by default at 3*ULN for ALT and AST and 2*ULN for BILI and ALP. These reference limits can be customized on the dialog. Additional information is listed below the plot.
These limits are also used to create the Hy's Law indicator flag. Subjects with a test value exceeding 3*ULN for ALT or AST (signs of hepatocellular injury) accompanied or followed by elevation of 2*ULN or greater for the BILI test have a "Yes" value for the Hy's Law Case variable created. You can change the number of days following ALT/AST elevation for which to look for BILI elevation to flag possible Hy's Law cases on the report dialog. You can choose to label the quadrants of Hy's Law (Cholestasis, Hy's Law, and Temple's Corollary) in the scatterplot through a check box option on the dialog.
Sankey Diagrams for Post-Baseline Migration
This plot displays the shift of liver injury enzyme measurements from baseline reference range to on trial reference ranges of the subjects by treatment arm. Subjects are colored by treatment group.
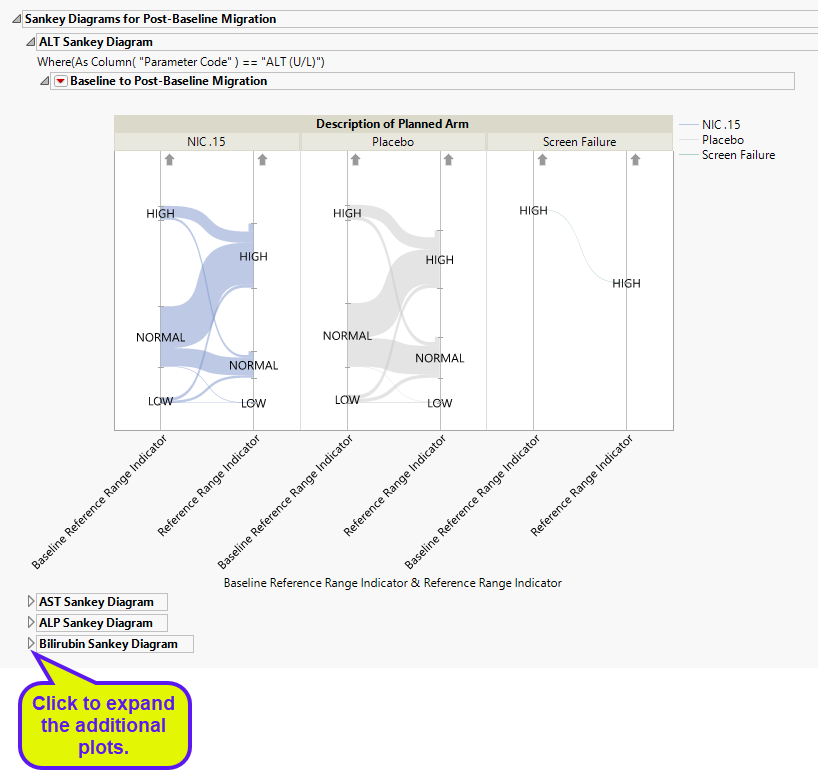
This report collects the findings test results for Bilirubin, Alanine Aminotransferase (ALT), laboratory test , Aspartate Aminotransferase (AST) and Alkaline Phosphatase (ALP), and constructs plots showing summaries of all post baseline test records for all of the patients when it finds reference range indicators. Results are grouped as high, normal, or low with respect to the Baseline Reference Range indicator and the Reference Range Indicator in each treatment arm.
Proportion of Patients in Each Quadrant for Hepatocellular DILI Screening Plot
The table shown is this section summarizes the results shown in the Peak Liver Test Results plot.
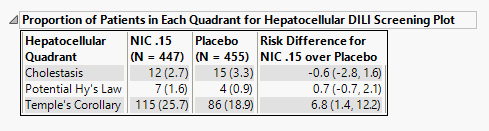
The number of patients as well as the percentage of patients (in parentheses) for each liver disease are displayed. Risk differences are calculated by subtracting the number of patients exhibiting changes, in maximum liver enzyme measurement values, indicative of damage in the control group from the number of patients exhibiting corresponding values in the treatment arm.
Proportion of Patients in Each Quadrant for Cholestatic DILI Screening Plot
The table shown in this section summarizes the patients showing evidence (high bilirubin and/or alkaline phosphatase) of cholestatic liver injury from the Peak Liver Test Results plot above.
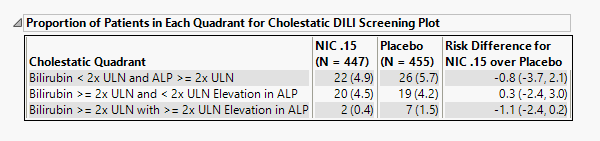
The number of patients as well as the percentage of patients (in parentheses) for Cholestatic disease are displayed. Risk differences are calculated by subtracting the number of patients exhibiting changes, in maximum bilirubin and/or ALP measurement values, indicative of damage in the control group from the number of patients exhibiting corresponding values in the treatment arm.
Proportion of Patients with Adverse Events by Hepatic Injury and Hepatic Failure FMQs
The table shown in this section summarizes adverse events suffered by patients in both treatment arms.
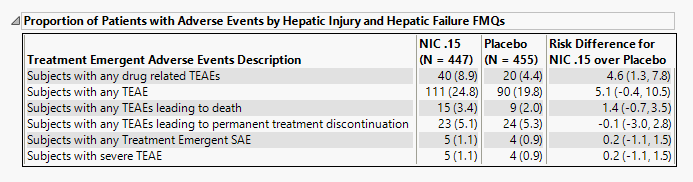
The number of patients as well as the percentage of patients (in parentheses) exhibiting adverse events are displayed. Risk differences are calculated by subtracting the number of patients exhibiting these events in the control group from the number of patients exhibiting corresponding values in the treatment arm.
Cumulative Incidence of Hepatic AEs by Hepatic Injury and Hepatic Failure FMQs
The plot in this section shows the cumulative incidence of liver-related adverse events for subjects in each treatment arm over the course of the treatment regime. It includes both unique as well as recurrent incidences.
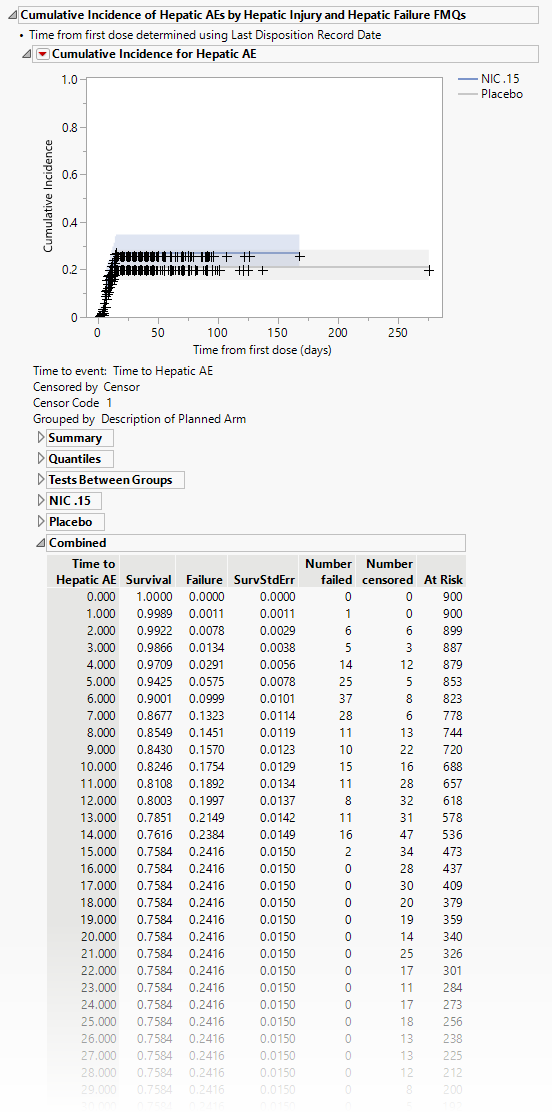
The tables summarize by day the number of patients either failing or being censored. Tables show either combined results or results divided by treatment arm.
Discontinuations and Lost to Follow-up with Liver Safety Lab Elevation or AE(s) (in Hepatic FMQs)
The plot in this section shows the proportion of patients with liver damage who either discontinued or left the trial.
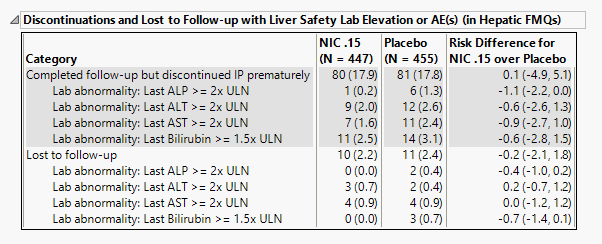
The number of patients as well as the proportion of patients (in parentheses) exhibiting abnormal liver tests and/or hepatic adverse events and either discontinued or were otherwise lost to follow-up assessments are displayed. Risk differences are calculated by subtracting the number of discontinued or lost patients in the control group from the number of patients exhibiting corresponding values in the treatment arm.
Adverse Events by Preferred Term in Hepatic Injury or Hepatic Failure FMQs by Treatment Group
The table in this section summarizes patient adverse events by FDA medical query and preferred term for patients in each treatment arm.
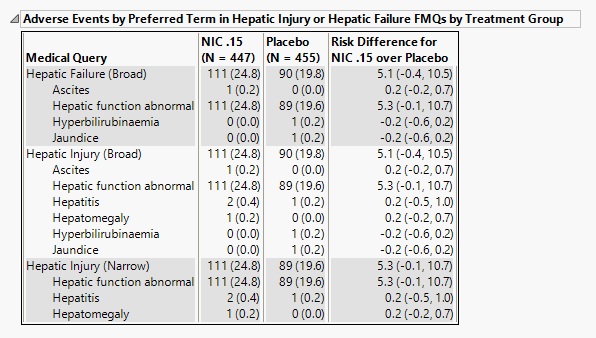
The number of patients as well as the proportion of patients (in parentheses) exhibiting adverse events in the hepatic injury and hepatic failure FDA medical queries. Risk differences are calculated by subtracting the number of patients in the control group from the number of patients exhibiting corresponding values in the treatment arm.
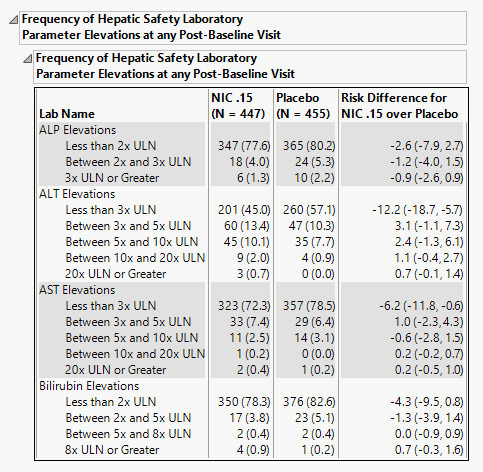
Frequency of Hepatic Safety Laboratory Parameter Elevations at any Post-Baseline Visit
Contains tables corresponding to elevations for ALT, AST, ALP and Bilirubin, and optionally, along with GGT, INR, and an additional specified lab test. Test Elevation, as well as counts and percentages for elevation categories for each liver test.
It contains the following elements:
| • | A table of Counts, Percents and risk differences for elevation categories for each liver test. Risk differences are calculated by subtracting the number of patients in the control group from the number of patients exhibiting corresponding values in the treatment arm. |
Results for the various tests are sorted into rows as described in the following tables:
| For ALT and AST | |
|---|---|
|
Row |
Contains subjects who show results that are: |
|
Less than 3x ULN |
less than 3x the upper limit of normal (ULN) |
|
Between 3x and 5x ULN |
inclusive of greater than or equal to 3x ULN and less than 5x ULN |
|
Between 5x and 10x ULN |
inclusive of greater than or equal to 5x ULN and less than 10x ULN |
|
Between 10x and 20x ULN |
inclusive of greater than or equal to 10x ULN and less than 20x ULN |
| 20x ULN or Greater | inclusive of equal to or greater then 20x ULN |
| For ALP | |
|---|---|
|
Row |
Contains subjects who show results that are: |
|
Less than 2x ULN |
less than 2x the upper limit of normal (ULN) |
|
Between 2x and 3x ULN |
inclusive of greater than or equal to 2x ULN and less than 3x ULN |
|
3x ULN or Greater |
equal to or greater then 3x ULN |
| For BILI | |
|---|---|
|
Row |
Contains subjects who show results that are: |
|
Less than 2x ULN |
less than 2x the upper limit of normal (ULN) |
|
Between 2x and 5x ULN |
inclusive of greater than or equal to 2x ULN and less than 5x ULN |
|
Between 5x and 8x ULN |
inclusive of greater than or equal to 5x ULN and less than 8x ULN |
| 8x ULN or Greater | all equal to or greater then 8x ULN |
| For Gamma-Glutamyl Transferase | |
|---|---|
|
Row |
Contains subjects who show results that are: |
|
Less than 2x ULN |
less than 2x the upper limit of normal (ULN) |
|
2x ULN or Greater |
equal to or greater then 2x ULN |
| For INR | |
|---|---|
|
Row |
Contains subjects who show results that are: |
|
Less than 1.5x ULN |
less than 1.5x the upper limit of normal (ULN) |
|
Between 1.5x and 3x ULN |
inclusive of greater than or equal to 1.5x ULN and less than 3x ULN |
|
Between 3x and 5x ULN |
inclusive of greater than or equal to 3x ULN and less than 5x ULN |
|
5x ULN or Greater |
equal to or greater then 5x ULN |
Note: Thresholds for ALT/AST and BILI/ALP are set based on guidelines from USDHHS, FDA and CDER (https://www.fda.gov/media/71665/download).
Cumulative Incidence for ALT Elevation > 3 times ULN
The plot in this section shows the cumulative incidence of ALT elevation above 3x ULN for subjects in each treatment arm over the course of the treatment regime. It includes both unique as well as recurrent incidences. Note: You can specify an alternate value for the comparator using the ALT Elevation greater than option.
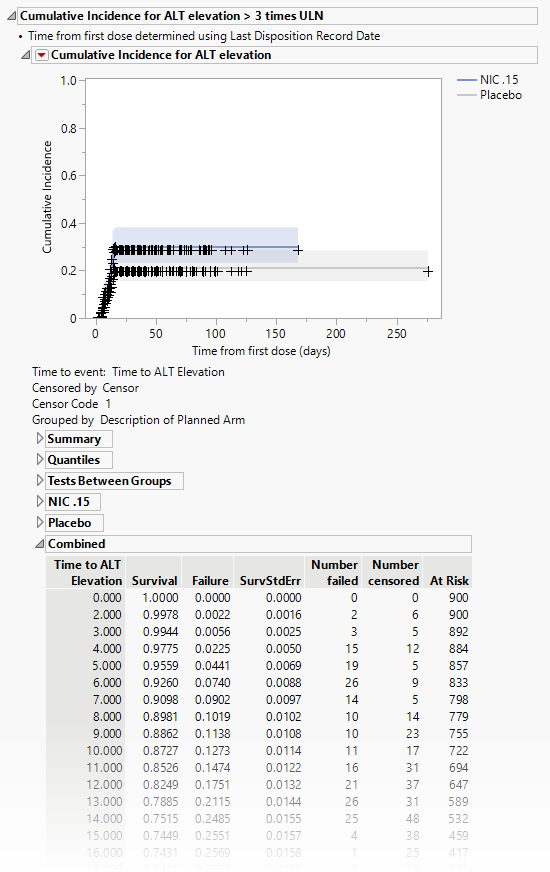
The tables summarize by day the number of patients either failing or being censored. Tables show either combined results or results divided by treatment arm.
Shift Plots
These plots show how findings levels change from baseline values as a result of treatment.
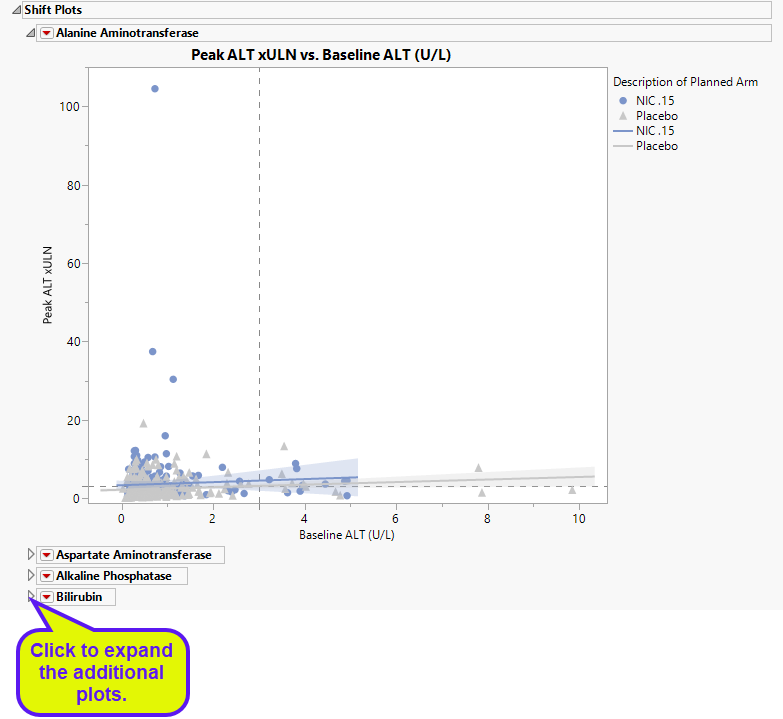
Blue points represent patients treated with nicardipine. Gray points represent patients receiving the placebo. The approximately square spread of points (with a diagonal line splitting approximately even across it) indicates similar variability of measurements before and after treatment.
Options
Data
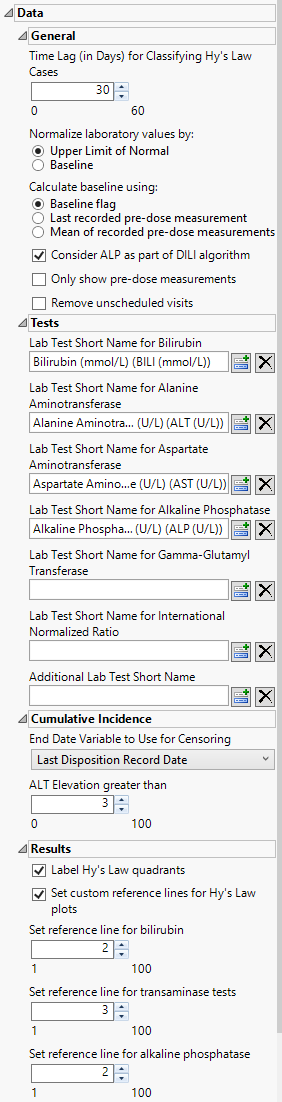
Time Lag (in Days) for Classifying Hy's Law Cases
Use this option to specify a lag time for classifying a subject as a Hy's Law case. See Time Lag (in Days) for Classifying Hy’s Law Cases for more information.
Normalize laboratory values by:
You can choose to normalize the measurements by either the ULN or the baseline measurements for each test. You can select either the last pre-dose values or the means of all pre-dose values as the baseline See Normalize laboratory values by: for more information.
Calculate baseline using:
Use this option to specify how the baseline findings measurements should be calculated for normalization. See Calculate baseline using: for more information.
Consider ALP as part of the DILI algorithm:
Use this option to include the ALP test measurements when determining whether a patient meets Hy's Law criteria.to determine possible Hy's law cases. See Consider ALP as part of the DILI algorithm for more information.
Only show predose measurements
Check this option to exclude all on-trial measurements from the analysis. This option enables you to observe all subjects at baseline. See Only show predose measurements for more information
Remove unscheduled visits
You can restrict the analysis to data from scheduled visits by checking the Remove unscheduled visits box.
Lab Test Short Name for Bilirubin
The Lab Test Short Name for Bilirubin option enables you to specify a non-standard test name for the bilirubin test. If this option is left blank, JMP Clinical uses the standard test designation.
Lab Test Short Name for Alanine Aminotransferase
The Lab Test Short Name for Alanine Aminotransferase option enables you to specify a non-standard test name for the alanine aminotransferase test. If this option is left blank, JMP Clinical uses the standard test designation.
Lab Test Short Name for Aspartate Aminotransferase
The Lab Test Short Name for Bilirubin option enables you to specify a non-standard test name for the aspartate aminotransferase test. If this option is left blank, JMP Clinical uses the standard test designation.
Lab Test Short Name for Alkaline Phosphatase
The Lab Test Short Name for Alkaline Phosphatase option enables you to specify a non-standard test name for the alkaline phosphatase test. If this option is left blank, JMP Clinical uses the standard test designation.
Lab Test Short Name for Gamma-Glutamyl Transferase
The Lab Test Short Name for Gamma-Glutamyl Transferase option enables you to specify a non-standard test name for the gamma-glutamyl transferase test. If this option is left blank, JMP Clinical uses the standard test designation.
Lab Test Short Name for International Normalized Ratio
The Lab Test Short Name for Bilirubin option enables you to specify a non-standard test name for the international normalized ratio. If this option is left blank, JMP Clinical uses the standard designation.
Additional Lab Test Short Name
The Additional Lab Test Short Name option enables you to specify an additional test yo be included in the analysis. I
End Date Variable to Use for Censoring
Use the End Date Variable to Use for Censoring option for specifying the end date for censoring. Options include the date of the last disposition (selected by default) and the record reference end date.
ALT Elevation greater than
By default, ALT levels equal to or greater 3*ULN are considered as events for the cummulative incidence screen. ALT levels below this values are not. You can change the value of this cutoff using the ALT Elevation greater than option.
Label Hy's Law quadrants
Selecting Label Hy’s Law quadrants places identifying labels, relating to Hy’s law, in each quadrant of all of the plots of bilirubin versus alanine aminotransferase.
Set custom reference lines for Hy's Law plots
Use the Set custom reference lines for Hy’s Law plots option to draw reference lines on the Hy’ Law plots. You must then specify reference lines for bilirubin, the transaminases, and alkaline phosphatase.
Set reference line for bilirubin
By default, the reference value for bilirubin is set to 2 or twice the ULN. You must then use the Set reference line for bilirubin option to specify an alternative value by which to multiply the ULN for bilirubin.
Set reference line for transaminase tests
By default. the reference value for the transaminase tests is set to 3 or 3x the ULN. You must use the Set reference line for transaminase tests option to specify an alternative value by which to multiply the ULN for alanine and/or aspartate transaminase.
Set reference line for alkaline phosphatase
By default, the reference value for alkaline phosphatase is set to 2 or twice the ULN. You must then use Set reference line for alkaline phosphatase option to specify an alternative value by which to multiply the ULN for alkaline phosphatase.
Display
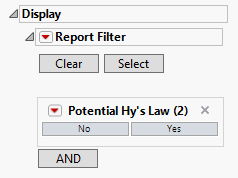
Report Filter
This widget enables you to subset and view subjects based on demographic characteristics and other criteria. By default, the filter in this report enables you to filter for potential Hy's law cases. Refer to Data Filter for more information on filters.
General and Drill Down Buttons
Action buttons, provide you with an easy way to drill down into your data. The following action buttons are generated by this report:
| • | Click  to reset all report options to default settings. to reset all report options to default settings. |
| • | Click  to view the associated data tables. Refer to Show Tables/View Data for more information. to view the associated data tables. Refer to Show Tables/View Data for more information. |
| • | Click  to generate a standardized pdf- or rtf-formatted report containing the plots and charts of selected sections. to generate a standardized pdf- or rtf-formatted report containing the plots and charts of selected sections. |
| • | Click  to generate a JMP Live report. Refer to Create Live Report for more information. to generate a JMP Live report. Refer to Create Live Report for more information. |
| • | Click  to take notes, and store them in a central location. Refer to Add Notes for more information. to take notes, and store them in a central location. Refer to Add Notes for more information. |
| • | Click  to read user-generated notes. Refer to View Notes for more information. to read user-generated notes. Refer to View Notes for more information. |
| • | Click  to open and view the Review Subject Filter. to open and view the Review Subject Filter. |
| • | Click  to specify Derived Population Flags that enable you to divided the subject population into two distinct groups based on whether they meet very specific criteria. to specify Derived Population Flags that enable you to divided the subject population into two distinct groups based on whether they meet very specific criteria. |
Methodology
This report requires lab results for bilirubin, alanine aminotransferase, aspartate aminotransferase, and alkaline phosphatase. At least one of the standardized short name character strings listed in the following table must be present in the LBTESTCD column for each lab result.
|
Lab Test1: |
Required String: |
|
Bilirubin |
Either BILI or TBIL Note: If neither BILInor TBILare found, the report searches for and uses TBILI, TBL, BILT, BILTOT, and BIL (in that order). |
|
Alanine Aminotransferase |
Either ALT, ALAT, or SGPT |
|
Aspartate Aminotransferase |
Either AST, ASAT, or SGOT |
|
Alkaline Phosphatase |
Either ALP or ALKP Note: If neither ALP nor ALKP are found, the report searches for and uses ALK and APH, in that order. |
Patients are assessed for each finding or adverse event they experience and Percent Occurrence and Risk Difference are calculated for each by treatment group. Percent Occurrence is simply the percentage of patients in a treatment group who experience the finding or event at least once during the trial period. Risk difference is calculated by subtracting the number of patients exhibiting the finding or event in the control group from the number of patients exhibiting the intervention in the treatment arm.