Patient Recruitment
Recruiting patients for clinical trials, especially multi-center ones, is a complex and time-sensitive process. Tight time lines and limited budgets are common in clinical trials. Delays in patient recruitment can result in extra costs, resource shortages, and significant trial delays. Additionally, insufficient patient recruitment increases the risk of a type II error, potentially leading to false results and misleading conclusions.
This report estimates the likelihood that recruitment goals are met using enrollment data collected so far. The estimated parameters are then used to predict future enrollment patterns given the existing number of study centers. If the projected enrollment falls short, adaptive adjustment is launched to predict the number of new centers necessary for the target enrollment to be reached by the deadline with a prespecified parameter New Center Delay Days.
Report Results Description
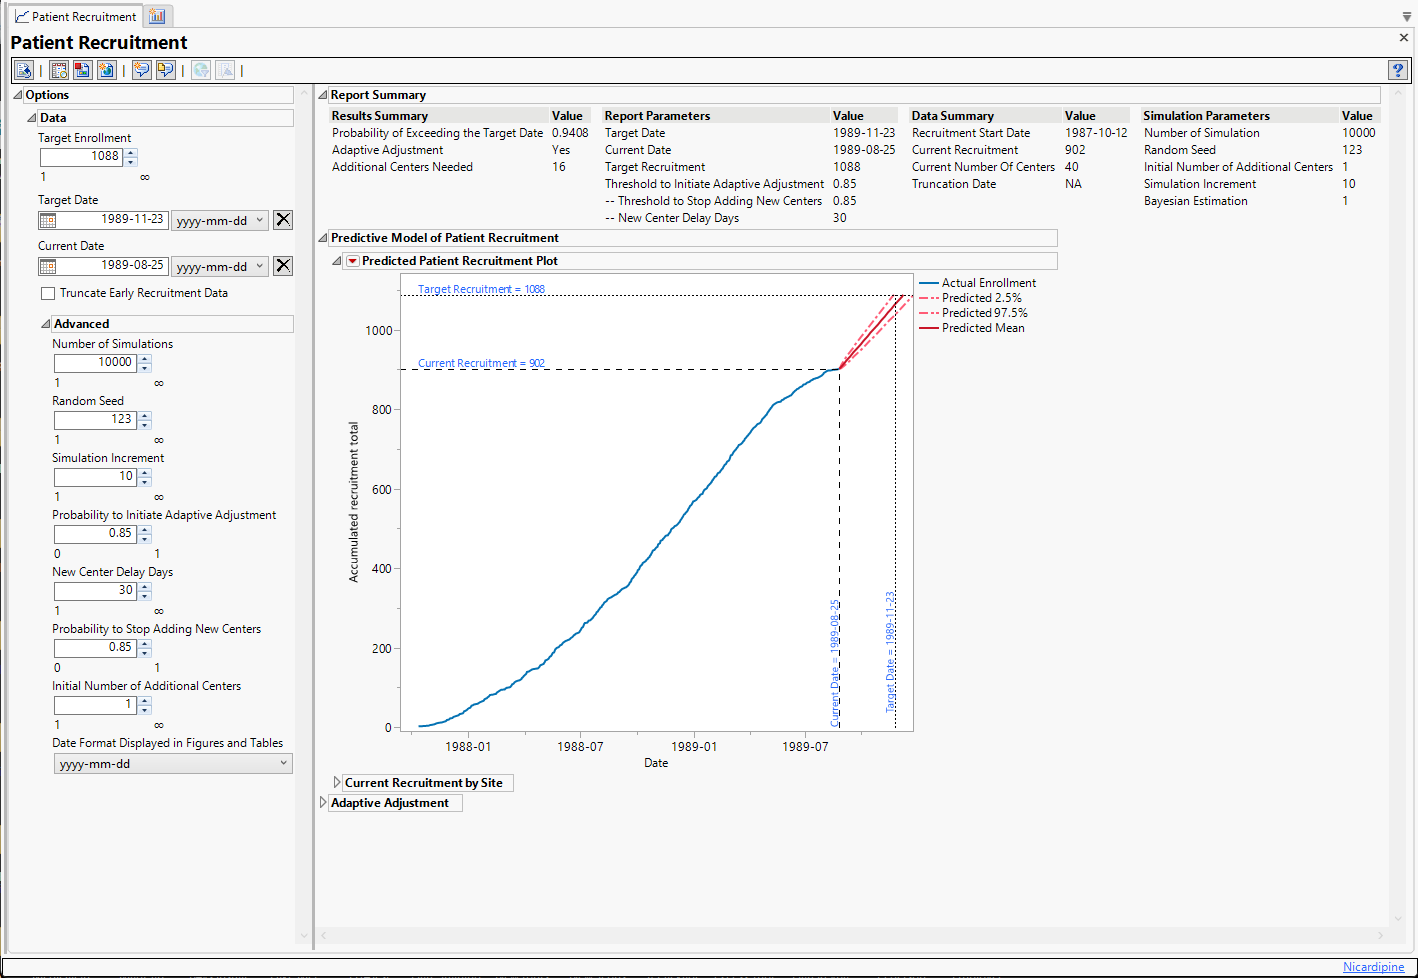
Running Patient Recruitment for the Nicardipine study with a target goal of recruiting 600 additional subjects within 7 months generates the report shown below:
Note: The recruitment target number and date in the example shown here were chosen to ensure that the Adaptive Adjustment algorithm was invoked.
The report consists of the following elements:
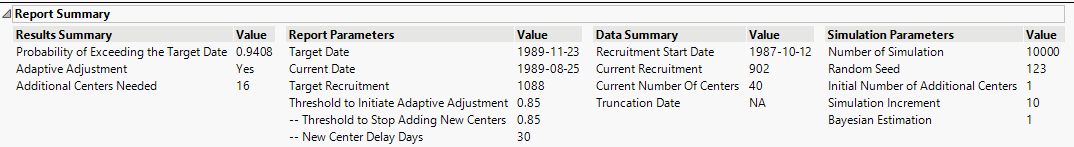
Report Summary
Displays a summary of the study, parameters used in simulations, and predicted results with regards to patient recruitment.
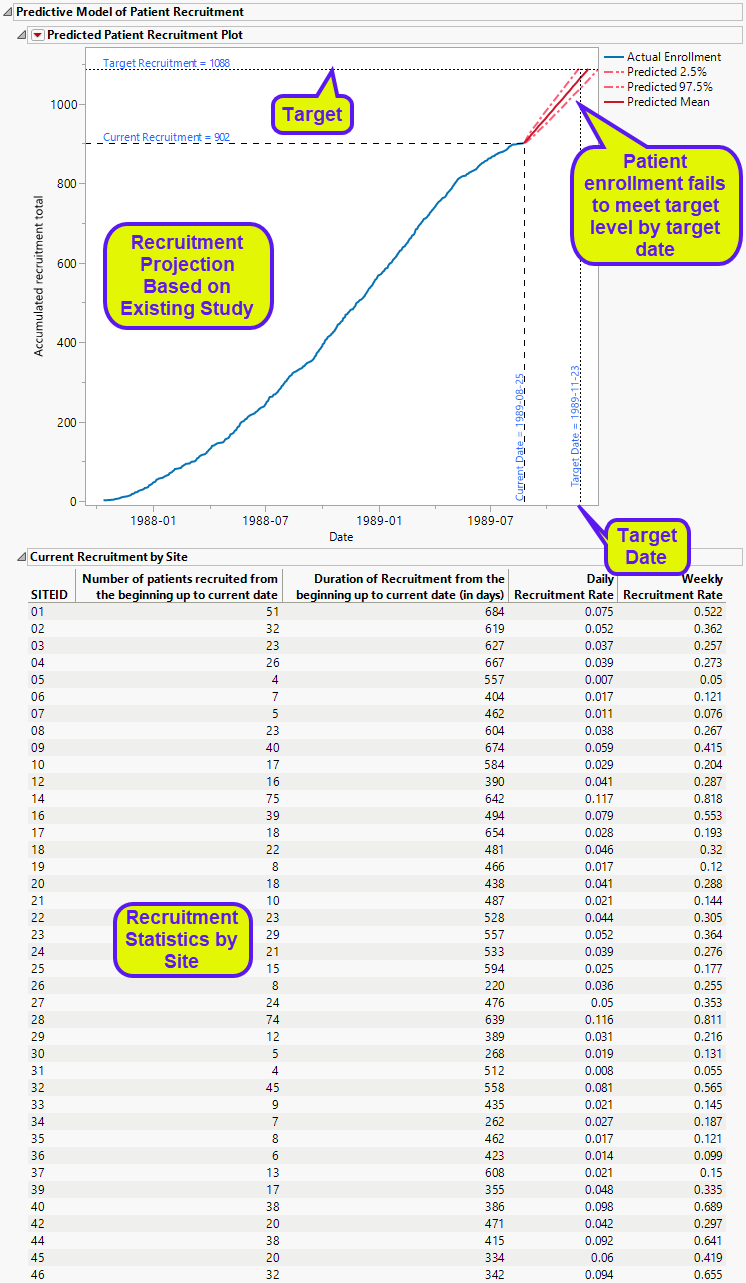
Predictive Model of Patient Recruitment
Displays recruitment history and predictions.
This section contains the following
| • | One plot showing patient recruitment over time along with the projected recruitment, based on recruitment history and assuming the number of study sites remains the same. Target recruitment numbers and deadline are indicated. To meet study requirements, projected enrollments must reach target levels before the deadline. |
In this example, projections suggest that, given the established number of study sites and rate of recruitment, the study will fail to recruit the desired number of subjects by the target date.
| • | One table summarizing recruitment statistics. |
Note: When predicted subject enrollment is insufficient, as shown in this example, the Adaptive Adjustment protocol is invoked.
Adaptive Adjustment
Displays the predicted probability of meeting the target date with the additional centers added, and the Date of Recruitment Completion as the number of new centers increases.
Note: This section is displayed only when recruitment is predicted to be insufficient.
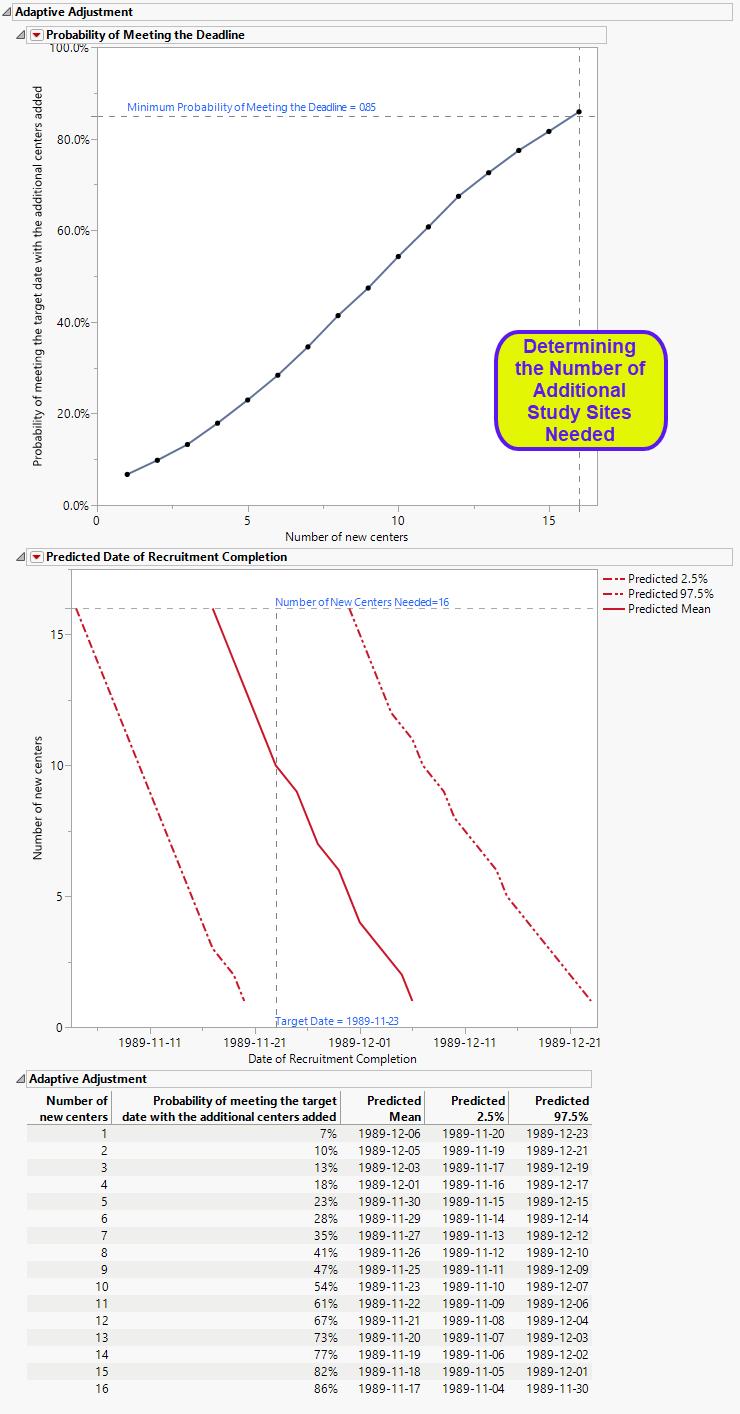
The Adaptive Adjustment section contains the following elements:
| • | One plot showing the predicted probability of meeting the target date with the additional centers added, with a reference line for the Minimum Probability of Meeting the Deadline at 85% (by default). |
In this example, a minimum of 16 additional centers are needed to meet recruitment goal by the target date.
| • | One plot showing the expected date of completion, given different numbers of additional centers. |
In this example, the predicted date of completion is met only by the addition of 16 new centers.
| • | One table summarizing the adjustment statistics. |
Options
Data
Use the options on this panel to customize your analysis.
Target Enrollment
The Target Enrollment option enables you to specify the number of subjects needed across all study sites for the study. This number needs to be greater than the current total enrolled subjects.
Target Date
The Target Date option enables you to specify the anticipated start date for the study. The date needs to be later than the Current Date.
Current Date
The Current Date option enables you to specify the current date. By default, this is the randomization date of the last enrolled subject.
Truncate Early Recruitment Data
The Truncate Early Recruitment Data option enables you to choose a start date to truncate early recruitment data.
Truncation Date
The Truncation Date option enables you to specify the start date for truncating early recruitment data. This option is available only when the Truncate Early Recruitment Data option is checked. The date needs to be later than the recruitment start date, and earlier than the Current Date.
Number of Simulations
The Number of Simulations option enables you to specify the number of simulations to be performed on the Poisson-Gamma modeling that are used to predict future enrollment. The default value is 10000. Smaller values may decrease the accuracy of the estimated recruitment date; while larger values may increase the computational time.
Random Seed
The Seed Number option enables you to specify a value used to generate reproducible random samples from specified distributions.
Simulation Increment
The Simulation Increment option is used to specify the amount of increment in enrollment when simulating the remaining time from current enrollment up to total enrollment. The default value is 10. If the total remaining number of patients to recruit is less than 50, the Simulation Increment parameter will be automatically adjusted to a smaller number.
Probability to Initiate Adaptive Adjustment
The Probability to Initiate Adaptive Adjustment option is used to specify the probability threshold for meeting the deadline before initiating adaptive adjustment. The default value is 0.85.
New Center Delay Days
The New Center Delay Days option is used to specify the number of days recruitment is delayed at the new centers. This value is taken into account when predicting the time remaining. The default number is 30.
Probability to Stop Adding New Centers
The Probability to Stop Adding New Centers option is used to specify the minimum probability threshold for meeting the target recruitment by the deadline. The default value is 0.85.
Initial Number of Additional Centers
The Initial Number of Additional Centers option is used to specify the initial number of new centers to be added to increase enrollment rate. The default value is 1.
Date Format Displayed in Figures and Tables
The Date Format Displayed in Figures and Tables option is used to specify the format of the date and time in figures and tables.
General and Drill Down Buttons
Action buttons, provide you with an easy way to drill down into your data. The following action buttons are generated by this report:
| • | Click  to reset all report options to default settings. to reset all report options to default settings. |
| • | Click  to view the associated data tables. Refer to Show Tables/View Data for more information. to view the associated data tables. Refer to Show Tables/View Data for more information. |
| • | Click  to generate a standardized pdf- or rtf-formatted report containing the plots and charts of selected sections. to generate a standardized pdf- or rtf-formatted report containing the plots and charts of selected sections. |
| • | Click  to generate a JMP Live report. Refer to Create Live Report for more information. to generate a JMP Live report. Refer to Create Live Report for more information. |
| • | Click  to take notes, and store them in a central location. Refer to Add Notes for more information. to take notes, and store them in a central location. Refer to Add Notes for more information. |
| • | Click  to read user-generated notes. Refer to View Notes for more information. to read user-generated notes. Refer to View Notes for more information. |
| • | Click  to open and view the Review Subject Filter. to open and view the Review Subject Filter. |
| • | Click  to specify Derived Population Flags that enable you to divided the subject population into two distinct groups based on whether they meet very specific criteria. to specify Derived Population Flags that enable you to divided the subject population into two distinct groups based on whether they meet very specific criteria. |
Methodology
This report is based on a predictive patient enrollment model using the method of built on a Poisson-Gamma distribution, under the assumption that the recruitment has been started, and is currently at an interim time point (Anisimov and Fedorov, 20071). Specifically, subjects are assumed to arrive at different centers according to Poisson processes, with recruitment rates viewed as a sample from a gamma distribution. The report first estimates the parameters with maximum likelihood method using enrollment data collected so far. The estimated parameters are then used to predicts future enrollment pattern. If the target time will be missed, adaptive adjustment is launched to predict the number of new centers necessary for the target enrollment to be reached by the deadline.