Contingency Table
A contingency table is used to record and analyze the relationship between two or more categorical variables. The multivariate frequency distribution of the variables is displayed in a matrix format.

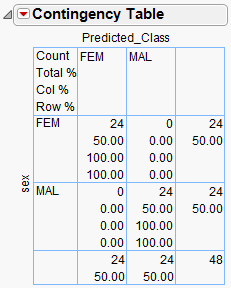
In the example shown above, true class is compared with predicted class, in terms of count, percentage of the total, percentage of the column, and percentage of the row. All 24 females and all 24 males have been correctly predicted. The grand total of 48 individuals is shown in the lower right cell.
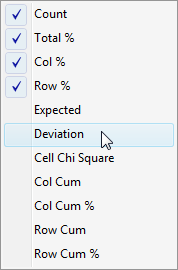
Specific cell content can be chosen using the red-triangle button in the heading bar.
