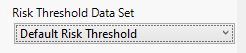
Risk Threshold Data TableSet
Use this drop-down menu to specify the risk threshold data table.
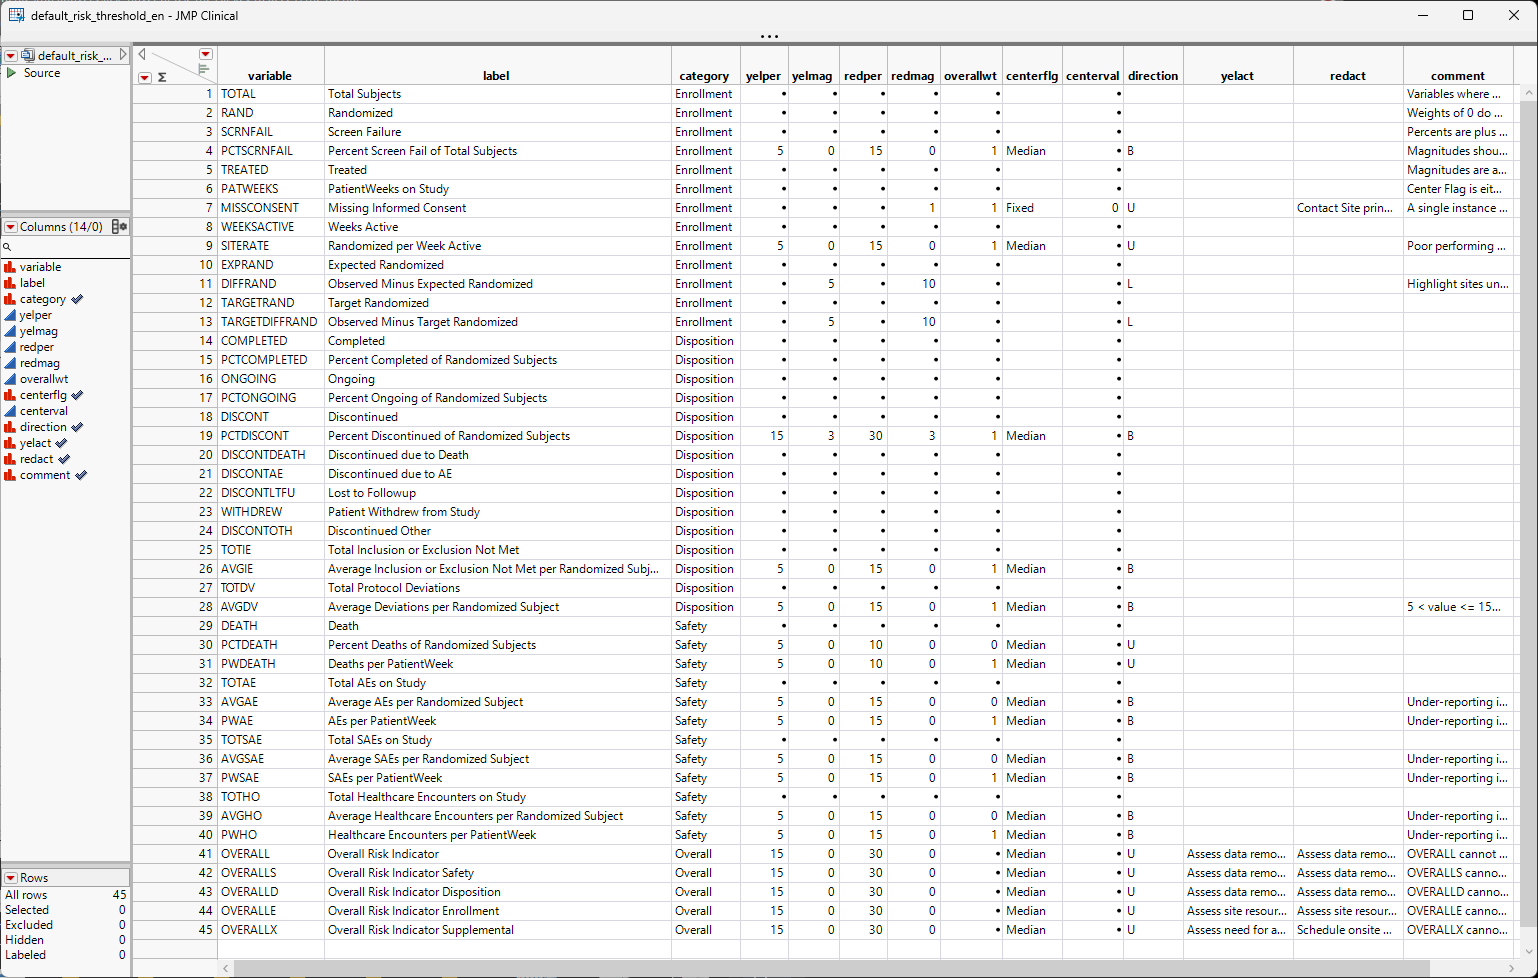
The Risk Threshold Data Table
The risk threshold data table is used as a reference to identify severe risk (marked with red in the graphs), moderate (marked with yellow in the graphs), mild or no risk (marked with green in the graphs). The default risk threshold data table is shown below:
Where is the risk threshold data table located?
The default risk threshold data table ( default_risk_threshold_**.jmp, ** indicates a language-specific suffix) is installed in your documents folder (C:\Users\User\Documents\JMPClinical18\Configurations\Default\RBM) when JMP Clinical is first installed on your computer. The contents of the RBM folder are shown below:
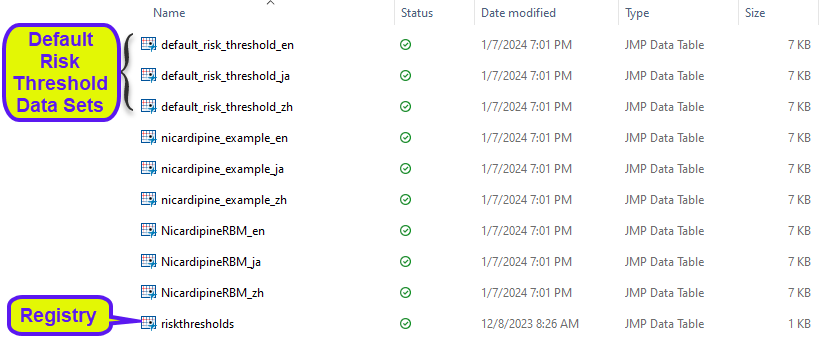
This folder contains 3 versions of the default risk threshold data table, one for (English (_en) one for Japanese (_ja), and one for Chinese (_zh). Additional versions exist specific for the Nicardipine sample data. Risk threshold data table must be located in this folder.
The Risk Threshold Registry File
The risk threshold registry file (riskthresholds.jmp, shown below) is also located in this folder. JMP Clinical uses this file to identify available risk threshold data tables.
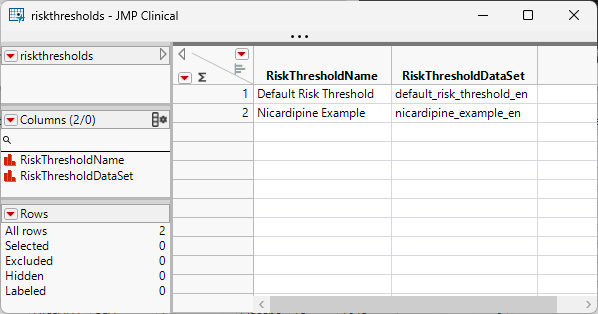
This file lists the available risk threshold data tables. A common use name (RiskThresholdName) and file name (RiskThresholdDataSet) must be specified in this file for each risk threshold data table.
How do I create a risk threshold data table specific for my study?
The default risk threshold data table can be used with any study. However, you can modify it or create your own to fit your study. To do this:
| 8 | Open the default risk threshold data table in JMP Clinical and modify it as needed |
| 8 | Use the Save As... command to save the modified data table with a new name in the same folder. |
| 8 | List a common use name and the file name in the riskthreshold.jmp registry file. |
| 8 | Close and restart JMP Clinical to make the modified risk threshold data table available. |
How to interpret the risk threshold data table?
The Default Risk Threshold data table contains 40 risk indicators. Some fall under the Enrollment category, some under the Disposition, and some under Safety category. There are Overall risk indicators as well, and users can specify how the individual risk indicators should contribute to the Overall through the OVERALLWT column. If there is a 0 or missing value in OVERALLWT column, then the risk indicator won’t contribute to the Overall. There is a full Overall and Overall for each category (Enrollment, Disposition, and Safety). If a supplemental file is set up, then users need to add the supplemental variables to the risk threshold data table and set up threshold definitions for them. All the variables that come from the supplemental file should have Supplemental as Category. Overall risk for supplemental variables can be calculated as well.
The YELPER (Yellow Percent of Center), YELMAG (Yellow Magnitude), REDPER (Red Percent of Center), REDMAG (Red Magnitude) and CENTERFLG column are used to calculate the Yellow Lower and Upper Thresholds and the Red Lower and Upper Thresholds. The acceptable values for CENTERFL are Mean, Median, and Fixed. If it is Fixed, a value in the CENTERVAL column must be provided. Direction can be B (for Both), U (for Upper), and L (for Lower). Many times we have B (both), because under reporting can be a red/yellow flag as well. For example if we look at the Average AEs per Randomized Subject (AVGAE) risk indicator, we have B, because not only a high number of AEs can indicate a problem, a low number might indicate under reporting of AEs.
To Specify a Risk Threshold Data Table:
| 8 | Select the desired risk threshold data set from the list of available data sets from the drop-down menu. |