Study Visit Report
This report generates a summary of the total subject clinic attendance in counts and percentages over the course of the study. Data from SV domain is used and results are presented in RTF or PDF format.
Report Results Description
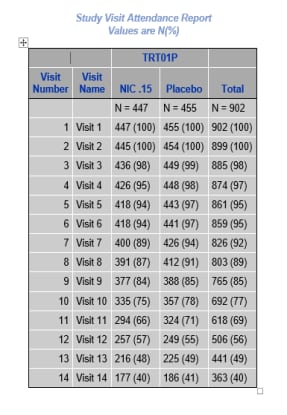
Running this report generates either a PDF or RTF file as shown.

For each visit determined by unique values of VISITNUM, the count and percentage of subjects attending the visit are presented by treatment and overall. A subject is considered to have attended a visit if they have a record of that visit within the SV domain. Otherwise, the subject is not considered to have attended that visit. If Visit Name (VISIT) is available, it is included in the summary.
Report Options

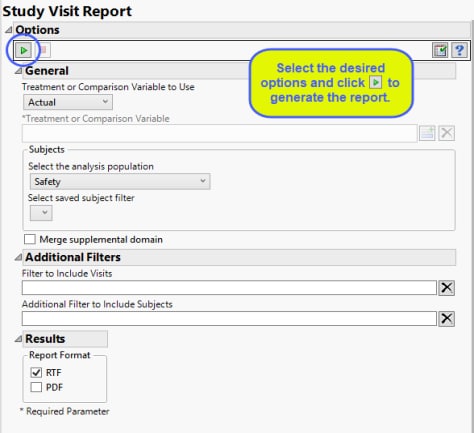
Treatment or Comparison Variable:
When specifying a treatment or comparison variable, a distribution of the selected variable is shown in the output and the demographic tables are categorized by the values of the variable.
Available variables include Planned, which is selected when the treatments patients received exactly match what was planned and Actual, which is selected when treatment deviates from what was planned. You can also specify any demographic variable from DM and/or ADSL as a surrogate for the treatment variables. Finally you can select None to plot the data without segregating it by a treatment variable.
See , for more information.
Filtering the Data:
Filters enable you to restrict the analysis to a specific subset of subjects and/or visits, based on values within variables. You can also filter based on population flags (Safety is selected by default) within the study data.
If there is a supplemental domain associated with your study, you can opt to merge the nonstandard data contained therein into your data.
See Select the analysis population, Select saved subject filter, or Additional Filter to Include Subjects
Output
You can use the output options to specify the format ( or ) of the final report.