Tabulate
This report tabulates the number of observations distributed among selected groups.
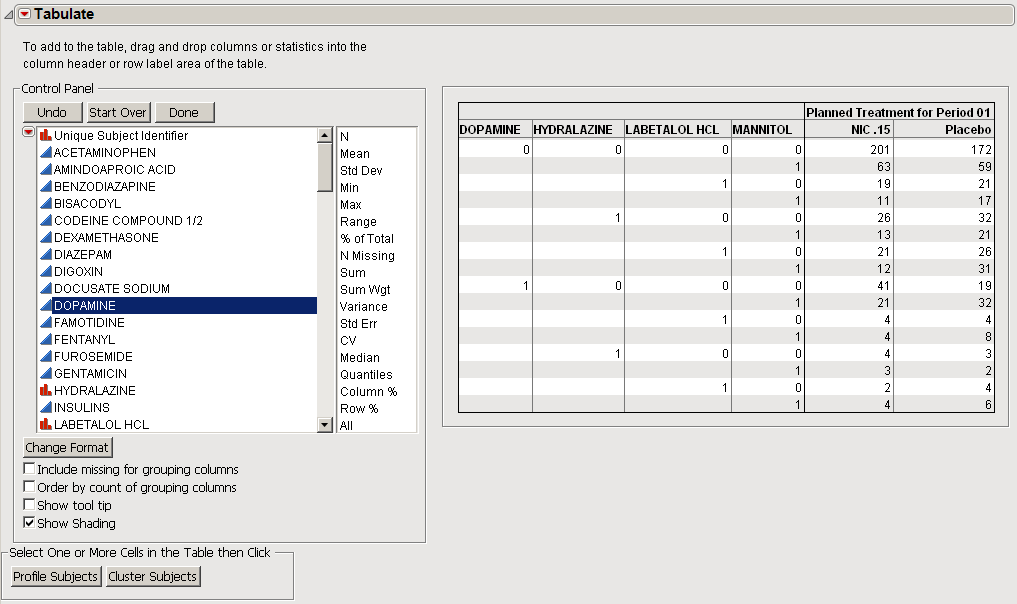
The example shown below was generated using the included Nicardipine data. Patients treated with hydralazine, labetalol HCL, and Mannitol, either alone or in combination, identified using the Interventions Risk Report report, were grouped and tabulated by medications.
Columns in the output data set generated by the Interventions Risk Report report are listed in the Control Panel (above, left). Different medication regimes are indicated by either a 1 (received medication) or 0 (did not receive medication) in the table at right. The total number of patients in each treatment arm (NIC .15 or Placebo), receiving a particular medication regime are indicated.
To add additional groupings to the table, complete the following steps:
| 8 | Click on the desired variable in the Control Panel. |
| 8 | Drag the selected variable into the results table. |
The table is updated to include all potential groupings. In the example shown below, dopamine was added to the table.

You can use additional buttons to change the format of the display. Additional action buttons include Patient Profiles and Cluster Subjects.