Parallel Plot
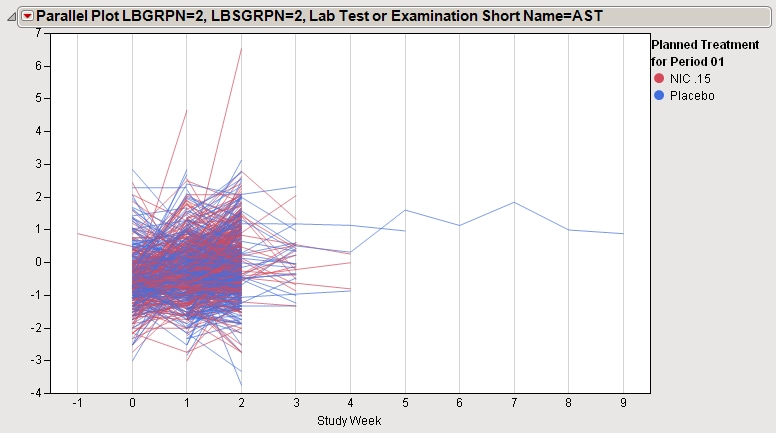
This plot consists of connected line segments across all responses for each row in a data table.

In the plot shown above, each line represents the levels of aspartate transaminase, relative to normal, in individual patients treated with nicardipine (NIC) or a placebo, over the course of the study.