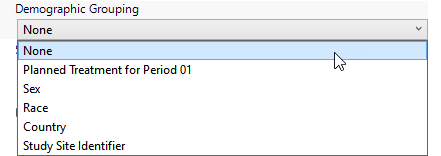
Demographic Grouping
Use this widget to segregate the results by demographics.

Available options are listed in the following table:
|
Option: |
Select when you want to: |
|
None |
Plot all of the subjects exhibiting each adverse event together with no demographic distinctions. |
|
Planned Treatment for Period 1 |
Plots subjects exhibiting each adverse event in separate plots based on the planned treatment. A separate plot is generated for each treatment. |
|
Sex |
Plots subjects exhibiting each adverse event in separate plots based on subjects' gender. |
|
Race |
Plots subjects exhibiting each adverse event in separate plots based on subjects' race. A separate plot is generated for each race. |
|
Country |
Plots subjects exhibiting each adverse event in separate plots based on the country in which the subjects' are found. A separate plot is generated for each country. |
| Study Site Identifier | Plots subjects exhibiting each adverse event in separate plots based on their study site. A separate plot is generated for each study site. |
To Specify a Demographic Grouping:
| 8 | Make a selection using the drop-down menu. |