Acute Kidney Injury
This report assesses the results of multiple lab tests enabling you to determine whether trial subjects have sustained acute kidney injury as a result of receiving the trial drug. Analysis results are presented and summarized in multiple graphs and tables.
Report Results Description
Running this report with the Nicardipine sample setting generates the report shown below.
The Report contains the following elements:
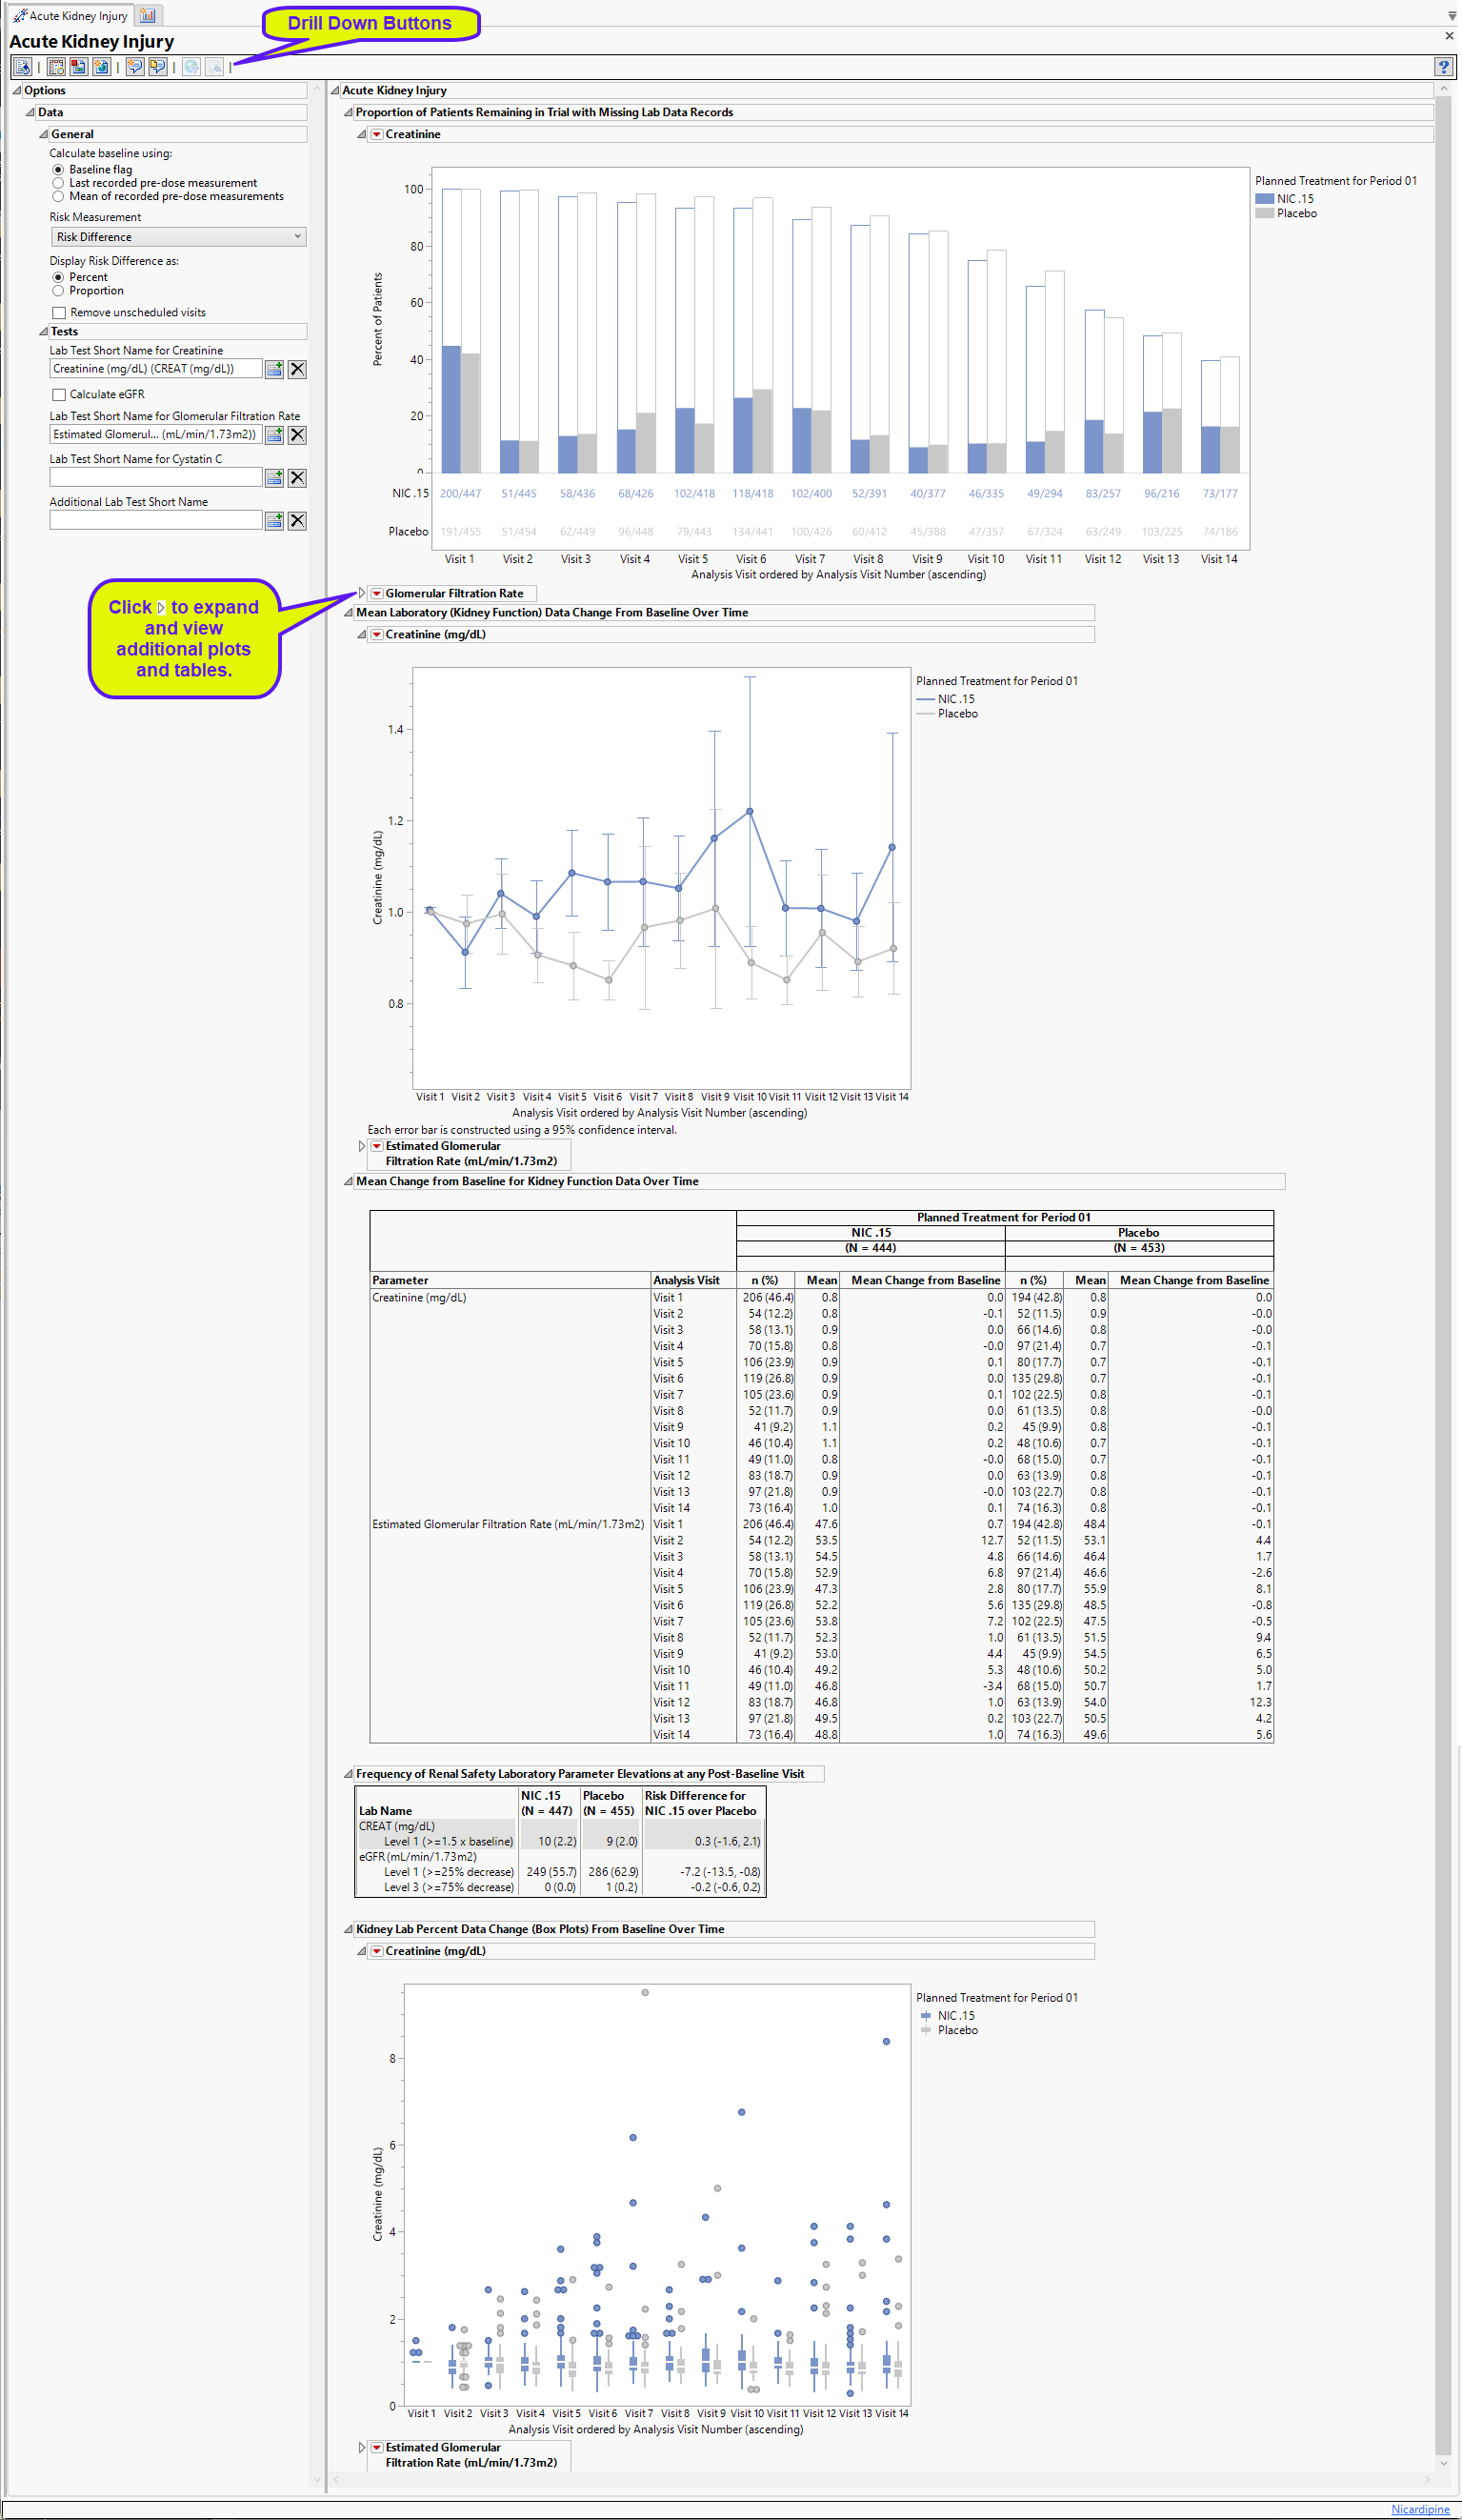
Proportion of Patients Remaining in Trial with Missing Lab Data Records
Contains 1-4 stacked Bar Charts (depending on the tests specified) showing the percent of subjects at each visit who either had relevant labs (filled bars) or were missing those tests (unfilled bars). Tests for creatine and the glomerular filtration rate are specified.
A separate plot is displayed for each specified test . Serum creatine and the glomerular filtration rate are shown here; additional tests for cystatin C and other moieties can be specified. Subjects are colored by treatment group.
The percentage of subjects with test data at each visit is shown by the filled bars. The relative number for this group is shown below the plot. There is a separate bar for each treatment arm. The percentage of subjects missing the test data is shown by the empty bar stack atop the filled bar. The total height of the stacked bar pair indicates the percentage of subjects for each arm present at the visit. Results shown are from both scheduled and unscheduled visits unless the Remove unscheduled visits option is checked.
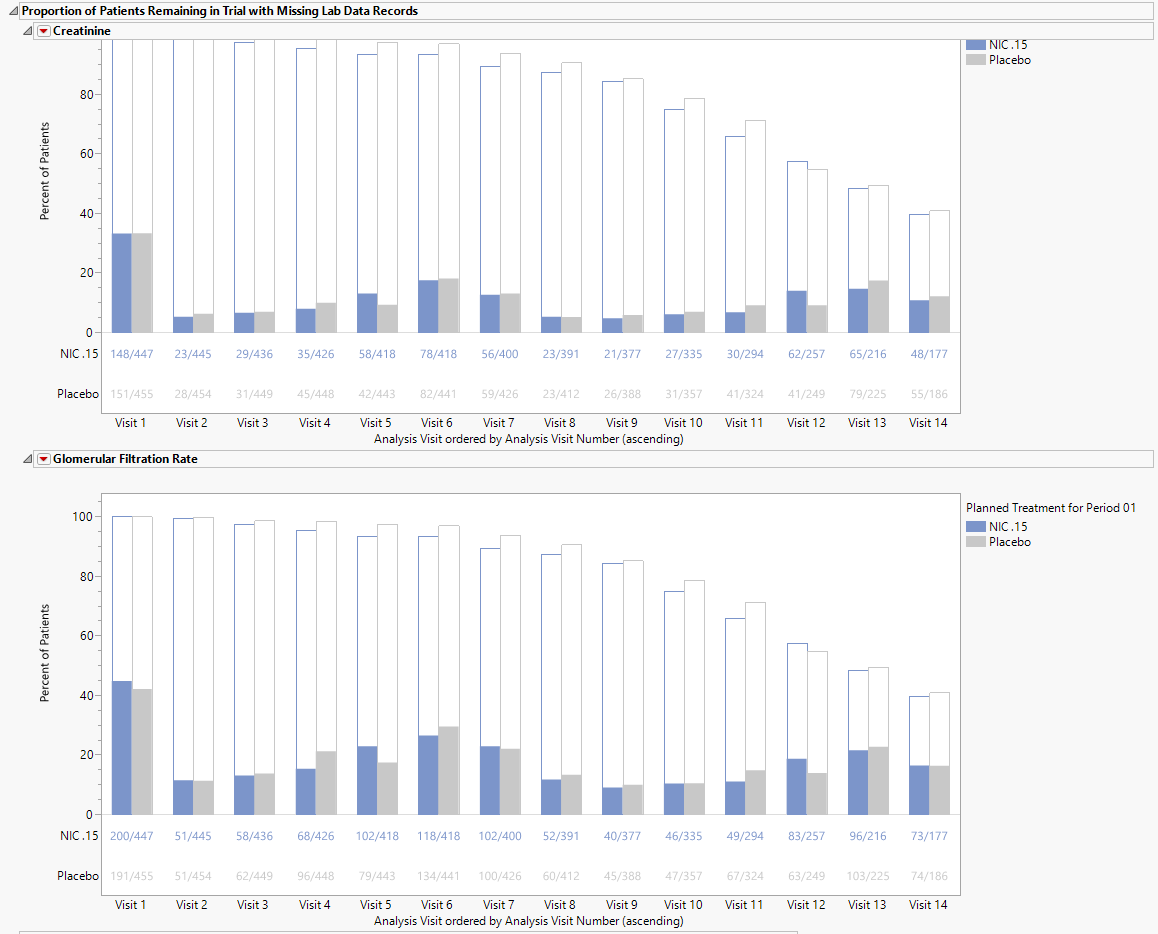
Mean Laboratory (Kidney Function) Data Change from Baseline Over Time
There is one plot for each quantitative findings test specified. Each plot contains a line for each treatment group representing the average change from baseline across time. Tests typically include serum creatinine concentration (mg.dL) and estimated Glomerular Filtration Rate (eGFR, mL/min/1.73 m2). Additional tests for cystatin C and other moieties can be specified.
Each plot displays the means of the measurements with 95% confidence intervals taken across time for each treatment arm. Visit numbers are plotted on the X axis. The Y axis represents the change from baseline.
Refer to Findings Time Trends for more information about these plots.
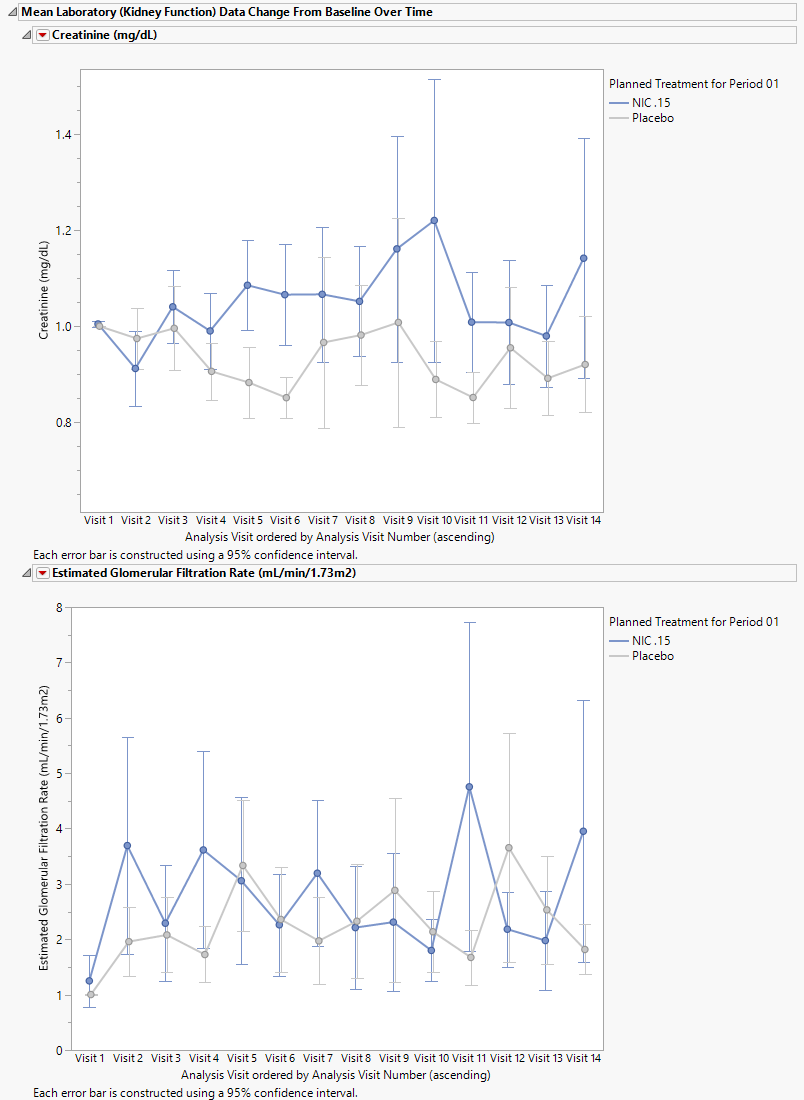
Mean Changes from Base Line for Kidney Function Data Over Time
This table lists the mean changes from baseline for each kidney function test for each treatment group over time.
Labs include serum creatinine (mg/dL) estimated glomerular filtration rate (mL/min/1.73 m3) and, cystantin c and an additional specified lab test. Metrics include the number ( and %) of patients in each treatment arm, the mean lab value, and the mean change from baseline).
Refer to Findings Mean Change from Baseline Tables for more information about this table.
Frequency of Renal Safety Laboratory Parameter Elevations at any Post-Baseline Visit
Contains tables corresponding to post-baseline elevations for serum creatinine (mg/dL) estimated glomerular filtration rate (mL/min/1.73 m3) and, cystantin c and an additional specified lab test. Test Elevation, as well as counts and percentages are presented for elevation categories for each test.
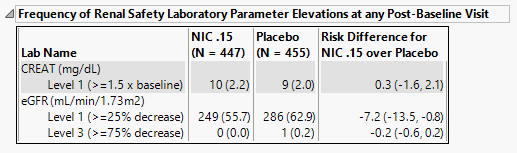
It contains the following elements:
| • | A table of Counts, Percents and risk differences for elevation categories for each test for each treatment arm, sorted into rows based of the level of change from baseline. Risk differences are calculated by subtracting the number of patients in the control group from the number of patients exhibiting corresponding values in the treatment arm. |
Kidney Lab Percent Data Change (Box Plots) from Baseline Over Time
These plots present the mean values with confidence intervals for each treatment at each time point. There is a separate plot for each specified test.
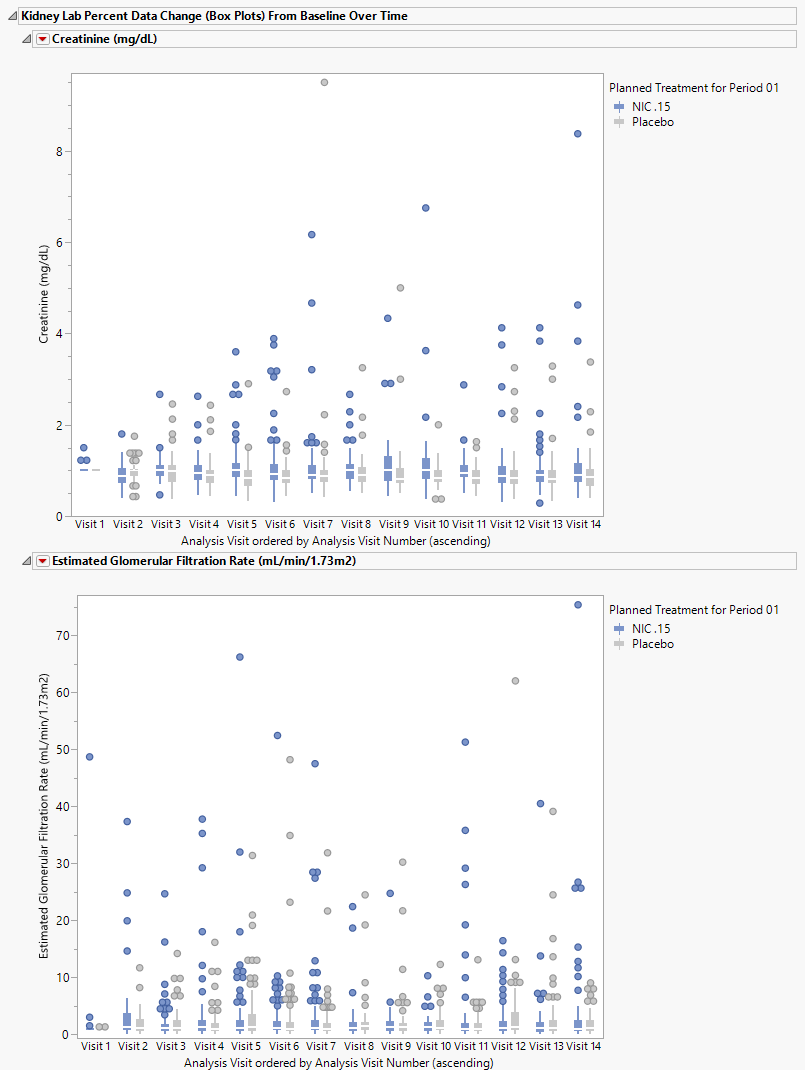
In this example there appear to be no significant changes in kidney functions across the time of the study.
The two plots shown above present the mean values for creatinine or the estimated glomerular filtration rate for patients in each treatment arm over time. The mean for each set of measurements is represented by the horizontal lines through the boxes. The vertical lines extending above and below the boxes represent the extent of the confidence intervals. Points outside of this region are considered outliers. Refer to Box Plots for more detailed information about box plots.
Options
Data
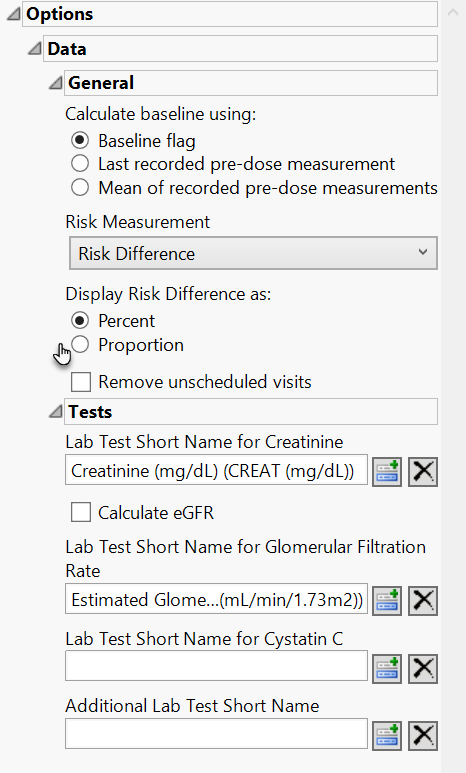
Calculate baseline using:
Use this option to specify how the baseline findings measurements should be calculated for normalization. See Calculate baseline using: for more information.
Risk Measurement
You have the option of calculating either the Risk Difference, the Relative Risk, or the Odds Ratio as the Risk Measurement.
Display Risk Difference as:
Use this widget to specify the difference between the risk of an event in the treatment arm and the control arm as either a percentage or a proportion of the total subject population. This widget appears only when you select Risk Difference as the Risk Measurement.
Remove unscheduled visits
You can restrict the analysis to data from scheduled visits by checking the Remove unscheduled visits box.
Lab Test Short Name for Creatinine
Use this text field to specify the Test Short Name (LBTESTCD) value that corresponds to the creatinine test, as described for bilirubin. Refer to Lab Test Short Name for Creatinine for more information.
Calculate eGFR
Check this option to calculate an estimate of the Glomeruler filtration rate. See Calculate eGFR for more information.
Lab Test Short Name for Glomeruler Filtration Rate
Use this text field to specify the Test Short Name (LBTESTCD) value that corresponds to the glomerular filtration rate test, as described for bilirubin. Refer to Lab Test Short Name for Glomerular Filtration Rate for more information.
Lab Test Short Name for Cystatin C
Use this text field to specify the Test Short Name (LBTESTCD) value that corresponds to the Cystatin C test, as described for bilirubin. Refer to Lab Test Short Name for Cystatin C for more information.
Additional Lab Test Short Name
The Additional Lab Test Short Name option enables you to specify an additional test yo be included in the analysis.
General and Drill Down Buttons
Action buttons, provide you with an easy way to drill down into your data. The following action buttons are generated by this report:
| • | Click  to reset all report options to default settings. to reset all report options to default settings. |
| • | Click  to view the associated data tables. Refer to Show Tables/View Data for more information. to view the associated data tables. Refer to Show Tables/View Data for more information. |
| • | Click  to generate a standardized pdf- or rtf-formatted report containing the plots and charts of selected sections. to generate a standardized pdf- or rtf-formatted report containing the plots and charts of selected sections. |
| • | Click  to generate a JMP Live report. Refer to Create Live Report for more information. to generate a JMP Live report. Refer to Create Live Report for more information. |
| • | Click  to take notes, and store them in a central location. Refer to Add Notes for more information. to take notes, and store them in a central location. Refer to Add Notes for more information. |
| • | Click  to read user-generated notes. Refer to View Notes for more information. to read user-generated notes. Refer to View Notes for more information. |
| • | Click  to open and view the Review Subject Filter. to open and view the Review Subject Filter. |
| • | Click  to specify Derived Population Flags that enable you to divided the subject population into two distinct groups based on whether they meet very specific criteria. to specify Derived Population Flags that enable you to divided the subject population into two distinct groups based on whether they meet very specific criteria. |
Methodology
Patients are assessed for each finding or adverse event they experience and Percent Occurrence and Risk Difference are calculated for each by treatment group. Percent Occurrence is simply the percentage of patients in a treatment group who experience the finding or event at least once during the trial period. Risk difference is calculated by subtracting the number of patients exhibiting the finding or event in the control group from the number of patients exhibiting the intervention in the treatment arm.