Digit Preference
This report assesses the use of terminal digits (either first or last in numerical findings) by study sites when reporting their clinical findings. It can be used to identify those sites that might exhibit biases in rounding issues or other problems with how they report data as compared with all other sites in the study.
Report Results Description
Running Digit Preference for Nicardipine using default settings generates the report shown below.
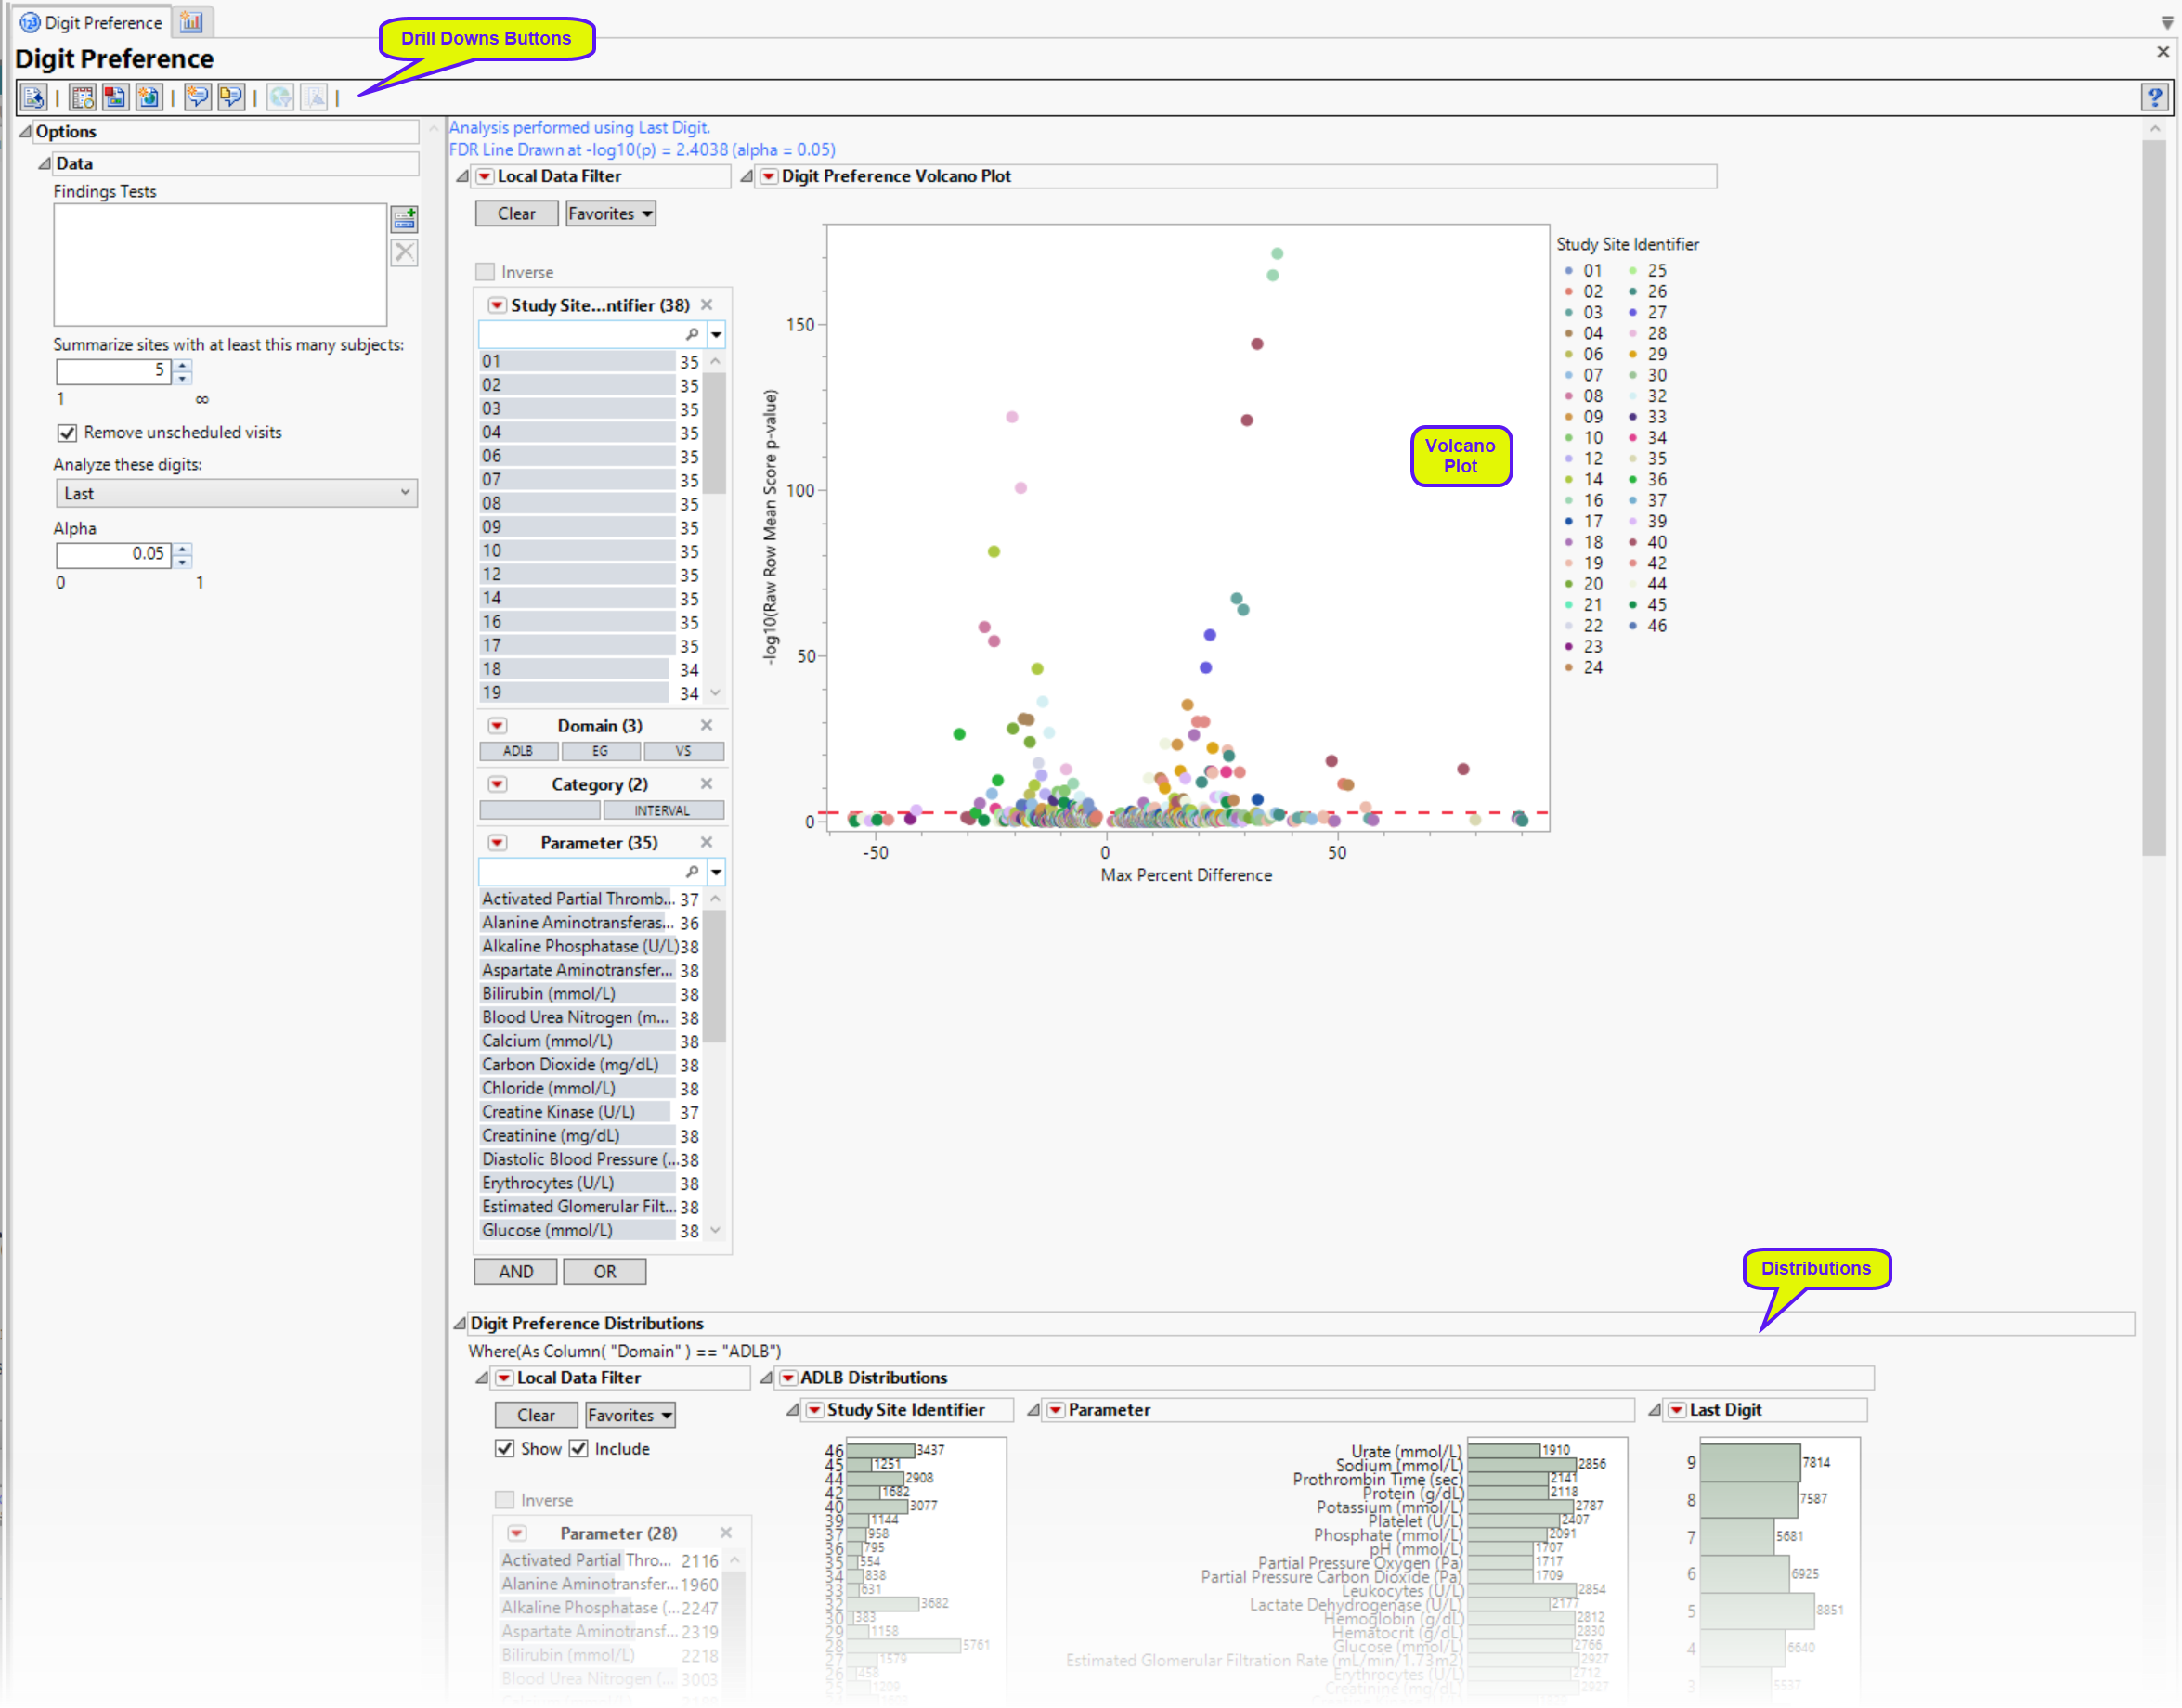
Digit Preference Volcano Plot
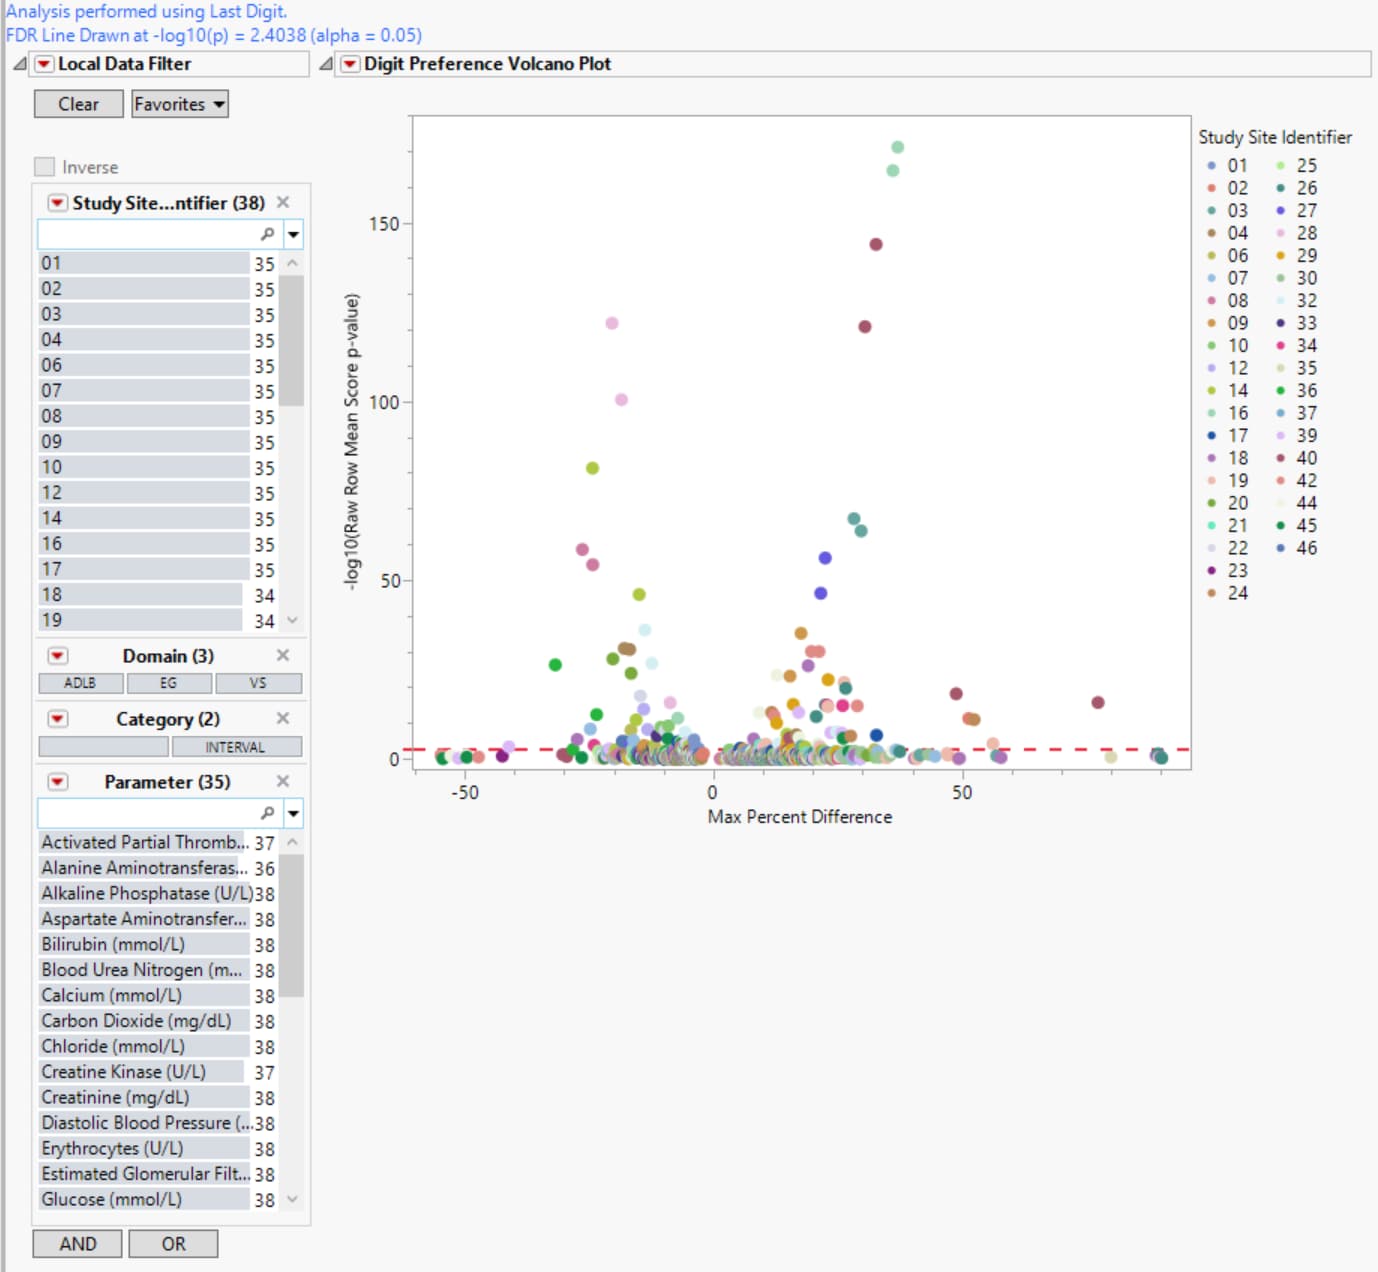
| • | In this volcano plot each point represents the comparison of a site to all other sites. This comparison is used to determine whether there is a difference in distribution for the last digit for a findings test with numeric data available and is done for all sites across all tests in all findings domains. |
The Y axis is the -log10(Raw Row Mean Score p-value), which takes advantage of the ordinality of the final digit value, This test uses standardized midrank scores in case there are gaps due to certain digit values not present. Midranks are a way of scoring the columns when the distance between levels does not necessarily have a practical interpretation. Large numbers on the Y axis indicate statistically significant results.
The X axis is the maximum percent difference1 across all digits between a site versus all sites. Values far from 0 indicate important differences between a site and the reference distribution of all other sites. This could identify rounding issues or other problems with how a site reports a particular test compared to other sites.
| • | A section filter enables you to subset and view subjects based on demographic characteristics and other criteria. The default filter enables you to select subjects by study site and lab results. Refer to Data Filter for more information. |
Digit Preference Distributions
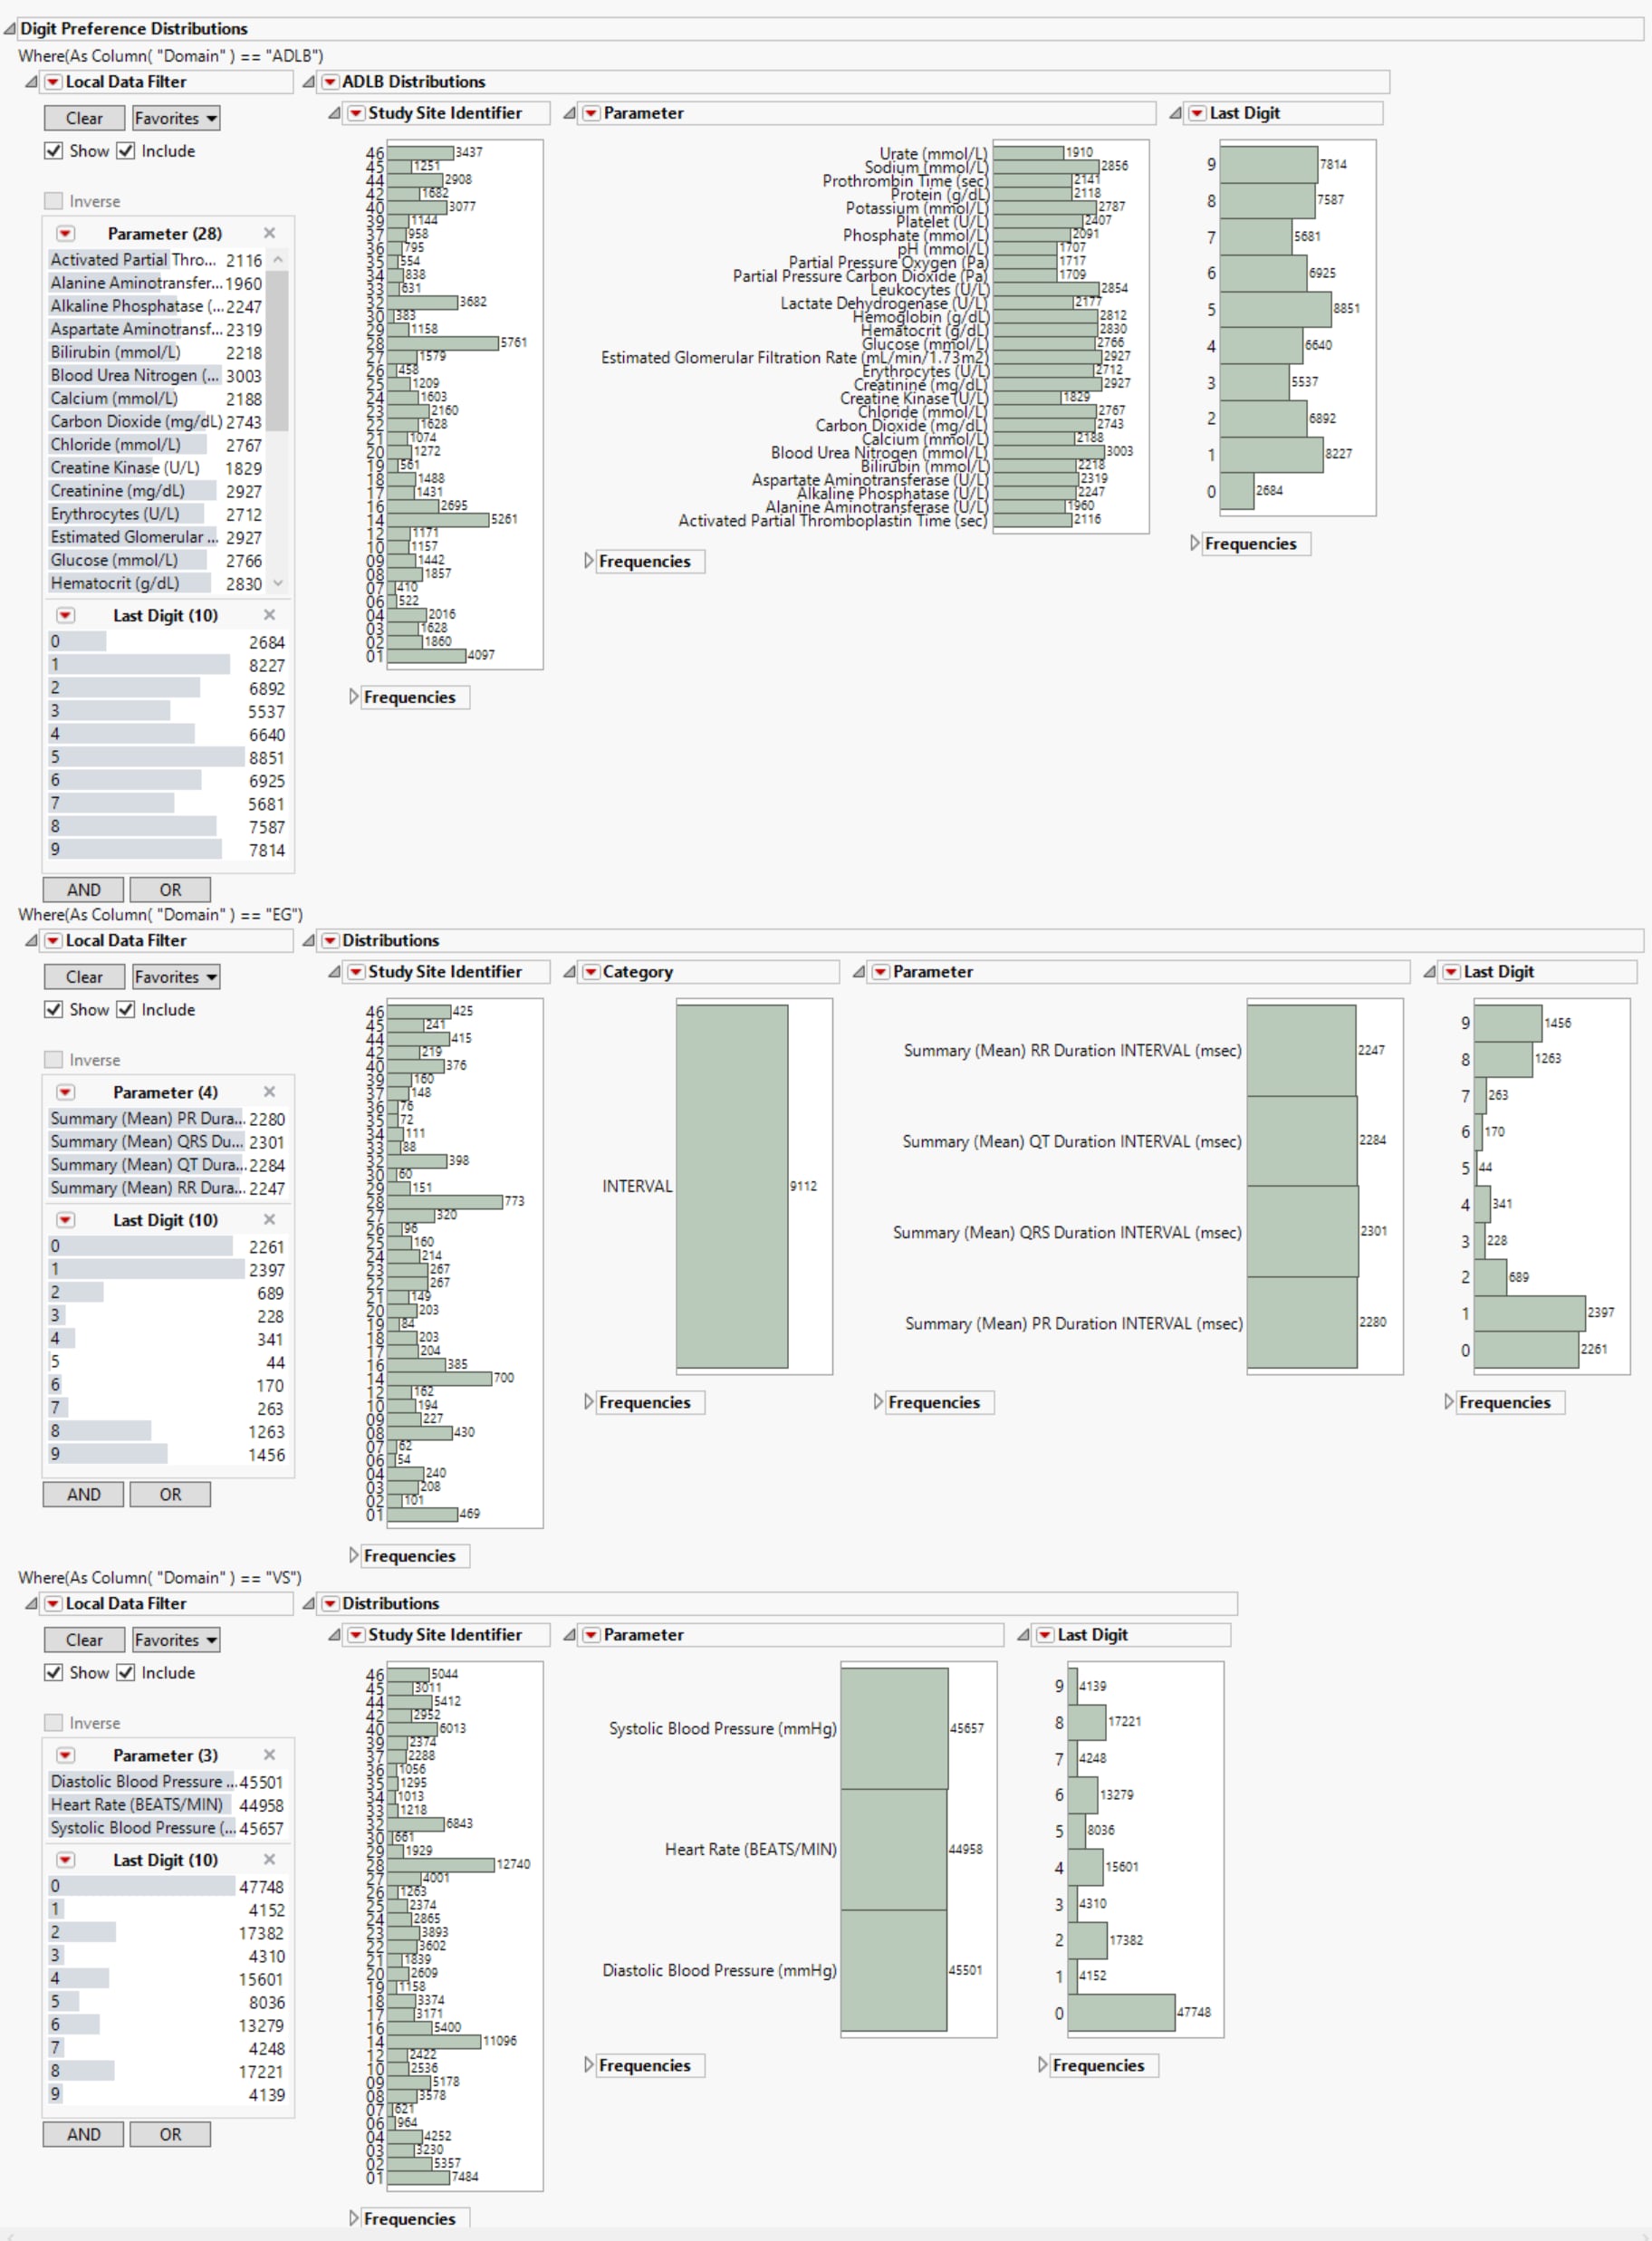
This report generates three sets of distributions, one for each of the LB (top), EG (middle), and VS (bottom) findings domains. Each set shows the number of tests performed at each study site, the numbers of each type of test, and the subjects delineated by the specified digit (first or last) of the subjects’ USUBJID. Selecting any group (for example, all tests for subjects whose USUBJID ends with “1”) as shown above, highlights those tests across all distributions.
Options
Data
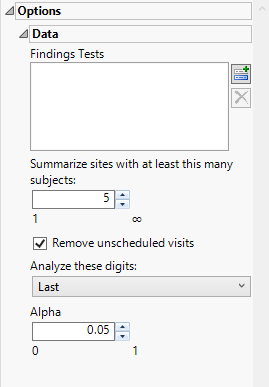
Findings Tests
Use this widget to select Findings Tests for the analysis. The report will autorun and analysis is restricted to the selected tests only.
Consider BY variables in the analysis
You can opt to Consider BY variables in the analysis. This option, which assumes that BY variables (left vs. right arm for collecting blood pressure data, for example) are included in the experimental design, is selected by default. You can uncheck this option to ignore BY variables.
Subset of Visits
Use the Subset of Visits option to select the visits to be included in the analysis.
Remove unscheduled visits
You might or might not want to include unscheduled visits when you are analyzing findings by visit. Check the Remove unscheduled visits to exclude unscheduled visits.
Summarize sites with at least this many subjects:
The Summarize sites with at least this many subjects: widget enables you to set a minimal threshold for the sites to be analyzed. Only those sites which exceed the specified number of subjects are included. This feature is useful because it enables you to exclude smaller sites, where small differences due to random events are more likely to appear more significant than they truly are. In larger sites, observed differences from expected attendance due to random events are more likely to be significant because any deviations due to random events are less likely to be observed.
Note: This option applies only to the volcano plot. The distribution plots still include all sites regardless of how this option is specified.
Analyze these digits
Use this widget to specify whether to analyze the first or last digits of any of the numeric findings. See Analyze these digits: for more information.
Alpha
The Alpha option is used to specify the significance level by which to judge the validity of the statistics generated by this report. By definition, alpha represents the probability that you will reject the null hypothesis when the null is, in fact, true. Alpha can be set to any number between 0 and 1, but is most typically set at 0.01, 0.05, or 0.10. The higher the alpha, the lower your confidence that the results you observe are correct.
General and Drill Down Buttons
Action buttons, provide you with an easy way to drill down into your data. The following action buttons are generated by this report:
| • | Click  to rerun the report using default settings. to rerun the report using default settings. |
| • | Click  to view the associated data tables. Refer to Show Tables/View Data for more information. to view the associated data tables. Refer to Show Tables/View Data for more information. |
| • | Click  to generate a standardized pdf- or rtf-formatted report containing the plots and charts of selected sections. to generate a standardized pdf- or rtf-formatted report containing the plots and charts of selected sections. |
| • | Click  to generate a JMP Live report. Refer to Create Live Report for more information. to generate a JMP Live report. Refer to Create Live Report for more information. |
| • | Click  to take notes, and store them in a central location. Refer to Add Notes for more information. to take notes, and store them in a central location. Refer to Add Notes for more information. |
| • | Click  to read user-generated notes. Refer to View Notes for more information. to read user-generated notes. Refer to View Notes for more information. |
| • | Select points in the volcano plot and click  to show the rows of the data table for the selected points. to show the rows of the data table for the selected points. |
| • | Select points in the volcano plot and click  to display a bar chart, comparing the last digit distribution between selected sites versus all others, for the points selected in the table. This gives the user the ability to compare just how different each site is for a particular test. to display a bar chart, comparing the last digit distribution between selected sites versus all others, for the points selected in the table. This gives the user the ability to compare just how different each site is for a particular test. |
Default Settings
Refer to Set Study Preferences for default Subject Level settings.
Methodology
Compare the observed distribution of the last or first digit for each test with each site (the suspect site, indexed with s) compared to all other sites taken together as a reference (indexed as o).
|
|
0 |
1 |
2 |
3 |
4 |
5 |
6 |
7 |
8 |
9 |
|
Suspect |
|
|
|
|
|
|
|
|
|
|
|
Others |
|
|
|
|
|
|
|
|
|
|
Compared using a row mean score chi-square tests (Stokes et al., 2012)2 to take advantage of the ordinality of the column variable.
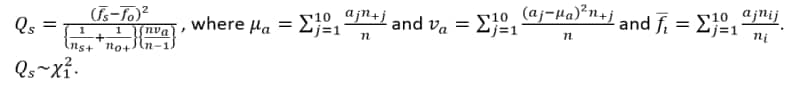
Scores are based on standardized midranks 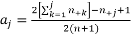 , often used when column values cannot necessarily be considered equally spaced (which tends to happen if not all digits are presented).
FDR p-values are calculated and the reference line is determined as described in How does JMP Clinical calculate the False Discovery Rate (FDR)?.
The Subset of Visits to Analyze options enables you to restrict to a specific subset of visits your search tests with similar and questionable results.