Disposition Distribution
This report generates tables showing the distribution of dispositions and associated risk differences of study patients across treatment arms.
Report Results Description
Running this report for Nicardipine using default settings generates the Report shown below.
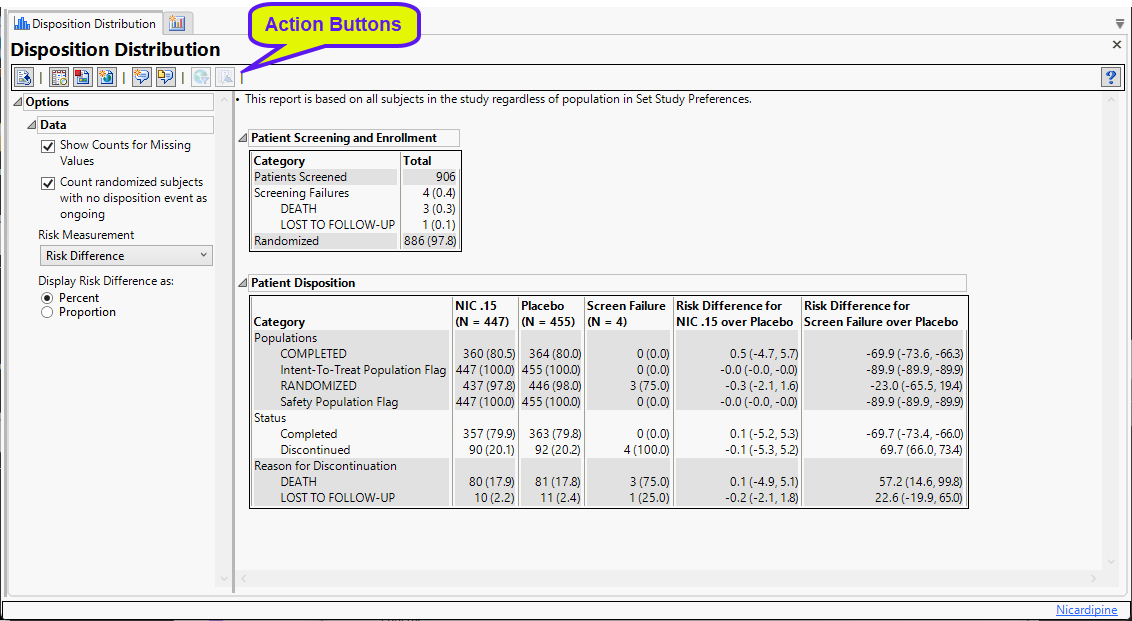
The report contains the following two tables:
Patient Screening and Enrollment
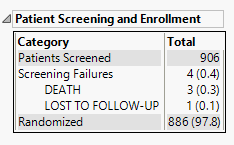
This table lists the number of subjects screened, enrolled, and randomized in the study as applicable, as well as the number of screen failures with the reason for failure..
Patient Disposition
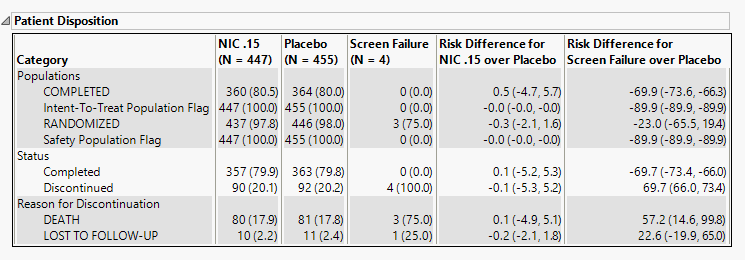
This table lists counts and percentages, along with risk difference measurements, of subjects dispositions by treatment arm. Categories include the study populations, completion status, and reason for discontinuation.
Options
Data
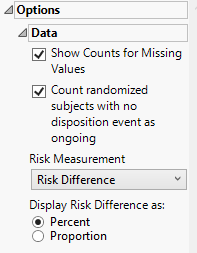
Show counts for missing values
Check this option to show counts of subjects who are missing disposition information. For example, subjects who left the study but the reasonfor their discontinuation is missing or subjects whose completion/discontinuation status is missing all together.
Count randomized subjects with no disposition event as ongoing
Check this box to count subjects who do not have a record in DS for either Completed or Discontinued as Ongoing for treatment and study status. Only subjects who have been randomized will be counted as Ongoing.
Risk Measurement
You have the option of calculating either the Risk Difference, the Relative Risk, or the Odds Ratio as the Risk Measurement.
Display Risk Difference as:
Use this widget to specify the difference between the risk of an event in the treatment arm and the control arm as either a percentage or a proportion of the total subject population. This widget appears only when you select Risk Difference as the Risk Measurement.
General and Drill Down Buttons
Action buttons, provide you with an easy way to drill down into your data. The following action buttons are generated by this report:
| • | Click  to reset all report options to default settings. to reset all report options to default settings. |
| • | Click  to view the associated data tables. Refer to Show Tables/View Data for more information. to view the associated data tables. Refer to Show Tables/View Data for more information. |
| • | Click  to generate a standardized pdf- or rtf-formatted report containing the plots and charts of selected sections. to generate a standardized pdf- or rtf-formatted report containing the plots and charts of selected sections. |
| • | Click  to generate a JMP Live report. Refer to Create Live Report for more information. to generate a JMP Live report. Refer to Create Live Report for more information. |
| • | Click  to take notes, and store them in a central location. Refer to Add Notes for more information. to take notes, and store them in a central location. Refer to Add Notes for more information. |
| • | Click  to read user-generated notes. Refer to View Notes for more information. to read user-generated notes. Refer to View Notes for more information. |
| • | Click  to open and view the Review Subject Filter. to open and view the Review Subject Filter. |
| • | Click  to specify Derived Population Flags that enable you to divided the subject population into two distinct groups based on whether they meet very specific criteria. to specify Derived Population Flags that enable you to divided the subject population into two distinct groups based on whether they meet very specific criteria. |
Methodology
This report includes all patients regardless of the population selected in Set Study Preferences. In the first table, the patients screened include all patients listed in the DM or ADSL dataset. Screen failures are categorized as any patient with a treatment value of “Screen Failure” and the corresponding reason for screen failure is the last record for each patient from the DS dataset where DSCAT = “Disposition Event”. The number of patients enrolled is determined using either the ENRLFL, ENRL, or ENROLLED variable with a value of Y, Yes, or 1. If none of those variables are included in the data, then the section is excluded from the table. The number of patients randomized is determined using either the RANDFL, RAND, RANDOMIZED, or RANDOM variable with a value or Y or 1 or the RANDDT variable with a non-missing value.
In the second table, the populations section summarizes all of the population flags in the study. The status section is determined by the values of DSDECOD in the DS domain where DSCAT = “Disposition Event”. If the value is either “Completed” or “Complete”, then the patient is counted as completed. Otherwise patients with a non-missing value for Disposition Event are counted as Discontinued. Patients missing a response for Disposition Event are either counted as Ongoing, Missing, or excluded depending on the option selections. The reason for discontinuation is included for subjects who were counted as discontinued by summarizing the values of DSDECOD where DSCAT = “Disposition Event”. If the reason is missing for any subject, a category of Missing will be added to the summary depending on the option selections. If EPOCH or DSSCAT exist in the DS domain, the status and reason for discontinuation sections of the table will be split by the values in these two variables.
No testing is performed. Analysis is restricted to tabulating counts/percentages of subjects based on their disposition.