Screening Bias
This report allows the analyst to identify any large within-site changes in values between two visits to identify regression to the mean in assessing study entry criteria. Analysis are performed using paired t-tests.
An example for subjective criteria is when investigators score a patient at a screening visit and based on this score the patient meets eligibility to get in the study. However, when the patient comes back at the randomization visit, the "more objective" investigator scores the patient noticeably differently. Or, it can pick up noticeable differences between the start and end of a placebo run-in when things are not expected to change.
FDR p-values are calculated and the reference line is determined as described in How does JMP Clinical calculate the False Discovery Rate (FDR)?.
Note: JMP Clinical uses a special protocol for data including non-unique Findings test names. Refer to How does JMP Clinical handle non-unique Findings test names? for more information.
Note: xxTPT should not have any visit-specific information in it, or it is liable to prevent a match using BY variables.
Report Results Description
The Report contains the following elements:
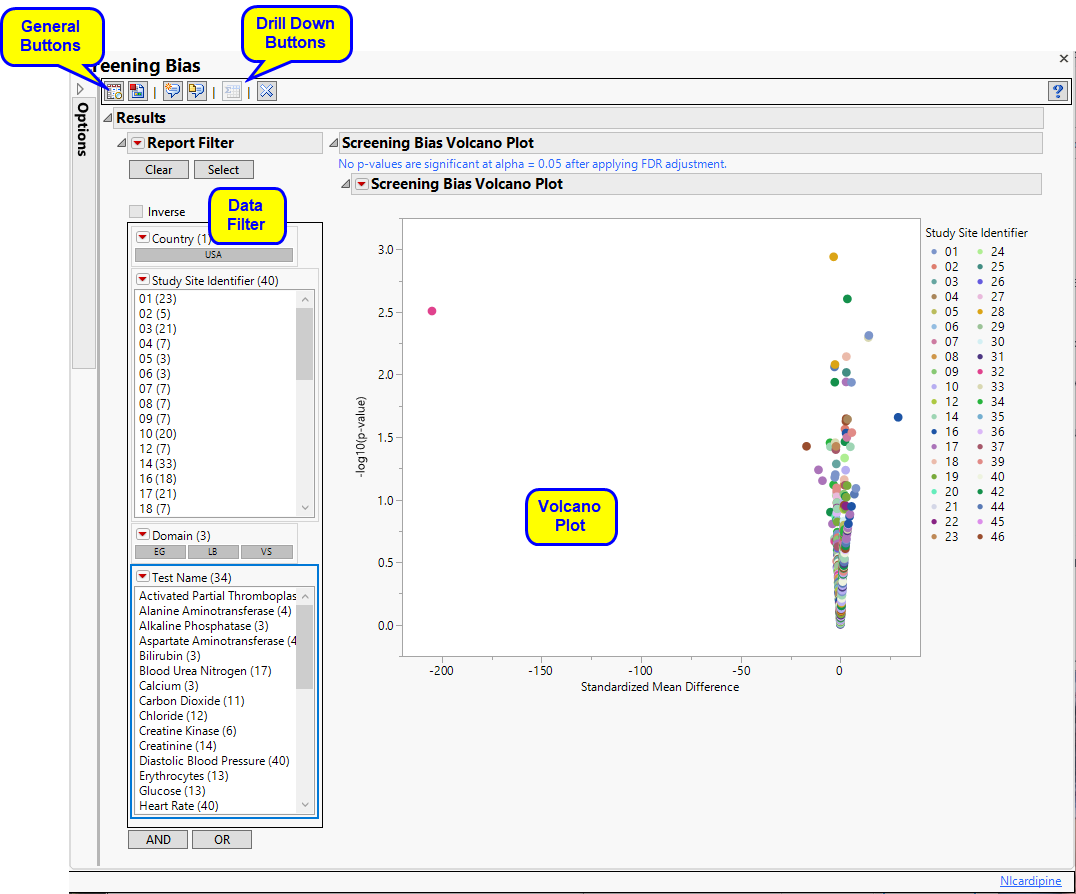
Screening Bias Volcano Plot
Shows a volcano plot used to find records where findings change significantly between one visit and the next.
This section contains the following elements.
| • | One Subject Filter. |
Enables you to subset subjects based on country of origin, study site and/or Test. Refer to Data Filter for more information.
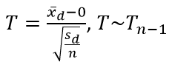
| • | One Volcano Plot. Shows a volcano plot used to find records where findings change significantly between one visit and the next. Screening bias compares all numerical variables. These ranges can be quite different from one another, so to summarize all of the variables in one plot, they are centered around 0 and scaled on the X axis using the standardized mean difference, which is:  |
This is the paired t-statistic which has n-1 degrees of freedom. When n is fixed, as it should be for all measurements coming from a site (unless there are missing data), all tests should have n measurements.
Screening Bias generates a number of paired t-test statistics, one for each Findings test for a specific site. These become significant as we depart from 0. Sets of values seem to have smooth curves here because the deviation from zero slows down as the difference gets larger and larger.
Each point represents a single Findings test for a specific site. You can mouse over points of interest to see their labels or select points by dragging a mouse rectangle over them (as shown above). Selected rows are highlighted in other plots and you can also then click on various Down Buttons for further analyses on those specific sites.
In this example, the unusual value at the upper left of the plot is selected.
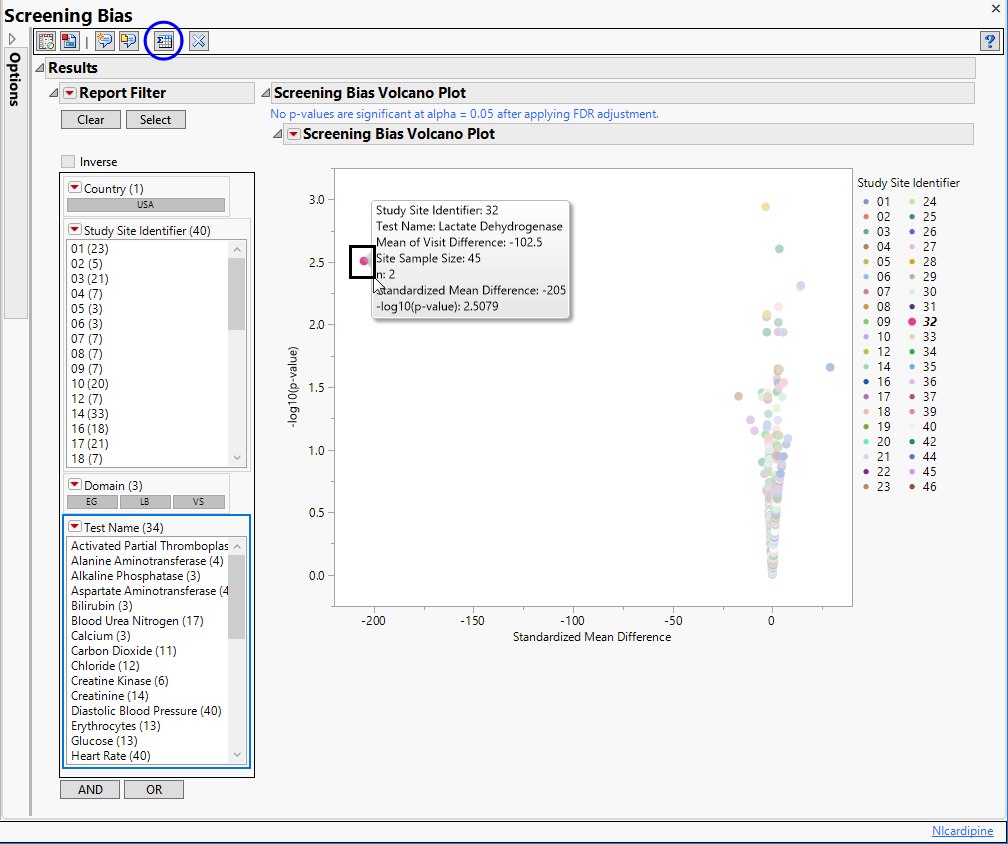
If you click  , a subset table containing the selected row with summary statistics is generated and displayed (below).
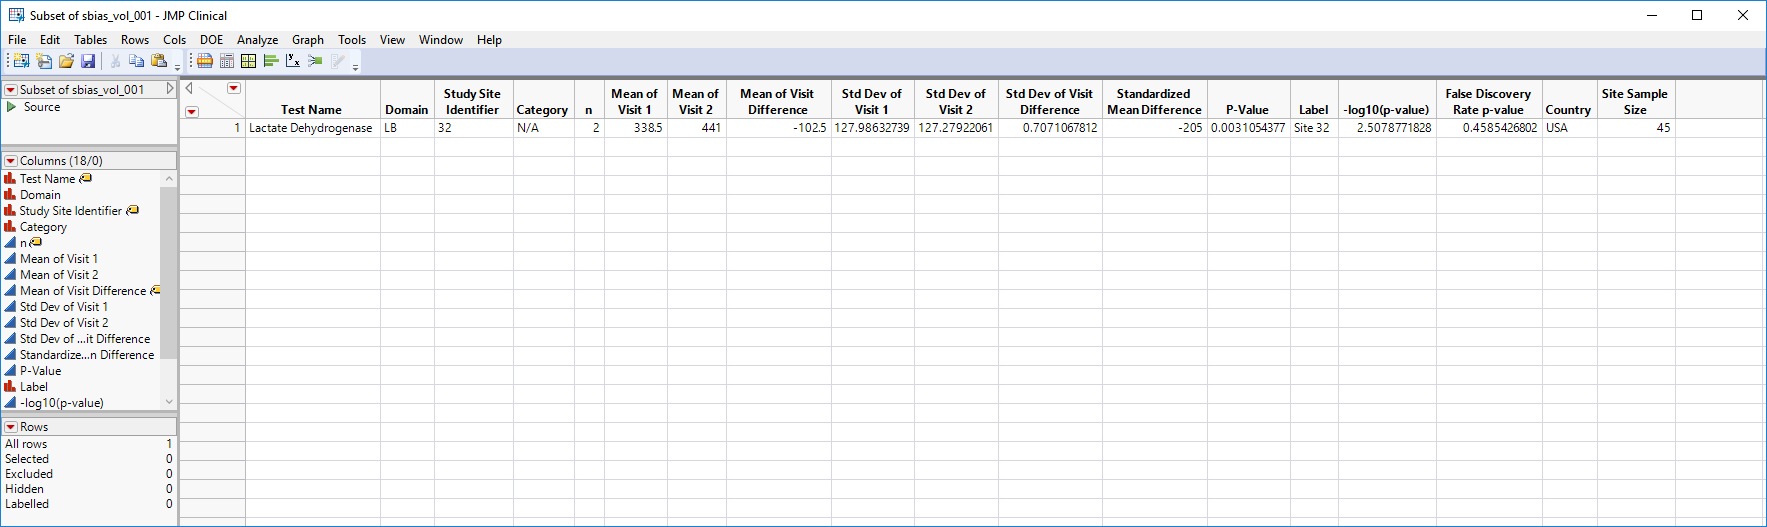
A very large Visit 1 - Visit 2 difference (increase) has been identified for lactate dehydrogenase for site 32. Visit 1 mean = 338.5 Visit 2 mean = 441 with Mean of V1 minus V2 Differences = -102.5. So there is an increase of 102.5 units which divided by the standard error gives a standardized difference of -205. This is a large change considering the observed variability and suggests further investigation.
Options
Data
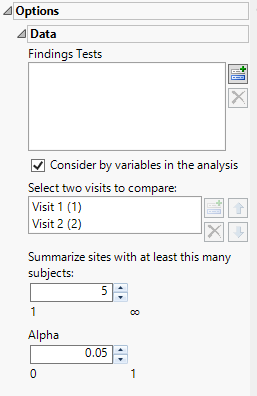
Findings Tests
Use this widget to select Findings Tests for the analysis. The report will autorun and analysis is restricted to the selected tests only.
Consider BY variables in the analysis
You can opt to Consider BY variables in the analysis. This option, which assumes that BY variables (left vs. right arm for collecting blood pressure data, for example) are included in the experimental design, is selected by default. You can uncheck this option to ignore BY variables.
Select two visits to compare:
Use this widget to select two visits to compare.
Summarize sites with at least this many subjects:
The Summarize sites with at least this many subjects: widget enables you to set a minimal threshold for the sites to be analyzed. Only those sites which exceed the specified number of subjects are included. This feature is useful because it enables you to exclude smaller sites, where small differences due to random events are more likely to appear more significant than they truly are. In larger sites, observed differences from expected attendance due to random events are more likely to be significant because any deviations due to random events are less likely to be observed.
Alpha
The Alpha option is used to specify the significance level by which to judge the validity of the statistics generated by this report. By definition, alpha represents the probability that you will reject the null hypothesis when the null is, in fact, true. Alpha can be set to any number between 0 and 1, but is most typically set at 0.01, 0.05, or 0.10. The higher the alpha, the lower your confidence that the results you observe are correct.
General and Drill Down Buttons
Action buttons, provide you with an easy way to drill down into your data. The following action buttons are generated by this report:
| • | Click  to reset all report options to default settings. to reset all report options to default settings. |
| • | Click  to view the associated data tables. Refer to Show Tables/View Data for more information. to view the associated data tables. Refer to Show Tables/View Data for more information. |
| • | Click  to generate a standardized pdf- or rtf-formatted report containing the plots and charts of selected sections. to generate a standardized pdf- or rtf-formatted report containing the plots and charts of selected sections. |
| • | Click  to generate a JMP Live report. Refer to Create Live Report for more information. to generate a JMP Live report. Refer to Create Live Report for more information. |
| • | Click  to take notes, and store them in a central location. Refer to Add Notes for more information. to take notes, and store them in a central location. Refer to Add Notes for more information. |
| • | Click  to read user-generated notes. Refer to View Notes for more information. to read user-generated notes. Refer to View Notes for more information. |
| • | Click  to display a table listing summary statistics for the selected points. to display a table listing summary statistics for the selected points. |
Refer to Set Study Preferences for default Subject Level settings.
Methodology
No testing is performed. Analysis is restricted to tabulating counts/frequencies of subjects exhibiting constant findings results.