Algorithmic FDA Medical Query Risk Report
This process uses FMQs with associated algorithms together with data from DMSEX to query AE, LB, and CM for subjects meeting the specified qualifications and then calculates risk measurements for each query. Output is a two-sided plot with a dot plot showing percent occurrence and forest plot showing risk measurement along with a table listing number (and percentage) of subjects exhibiting each FMQ by specific qualification.
Note: Refer to Medical Query Type for more information on FMQ files. This report is specific for FMQ version 2.1. This version consists of three JMP files that are automatically generated when JMP Clinical is installed. Modifications can be made for later versions of the FMQs, but this requires modifications to the JMP tables.
Report Results Description
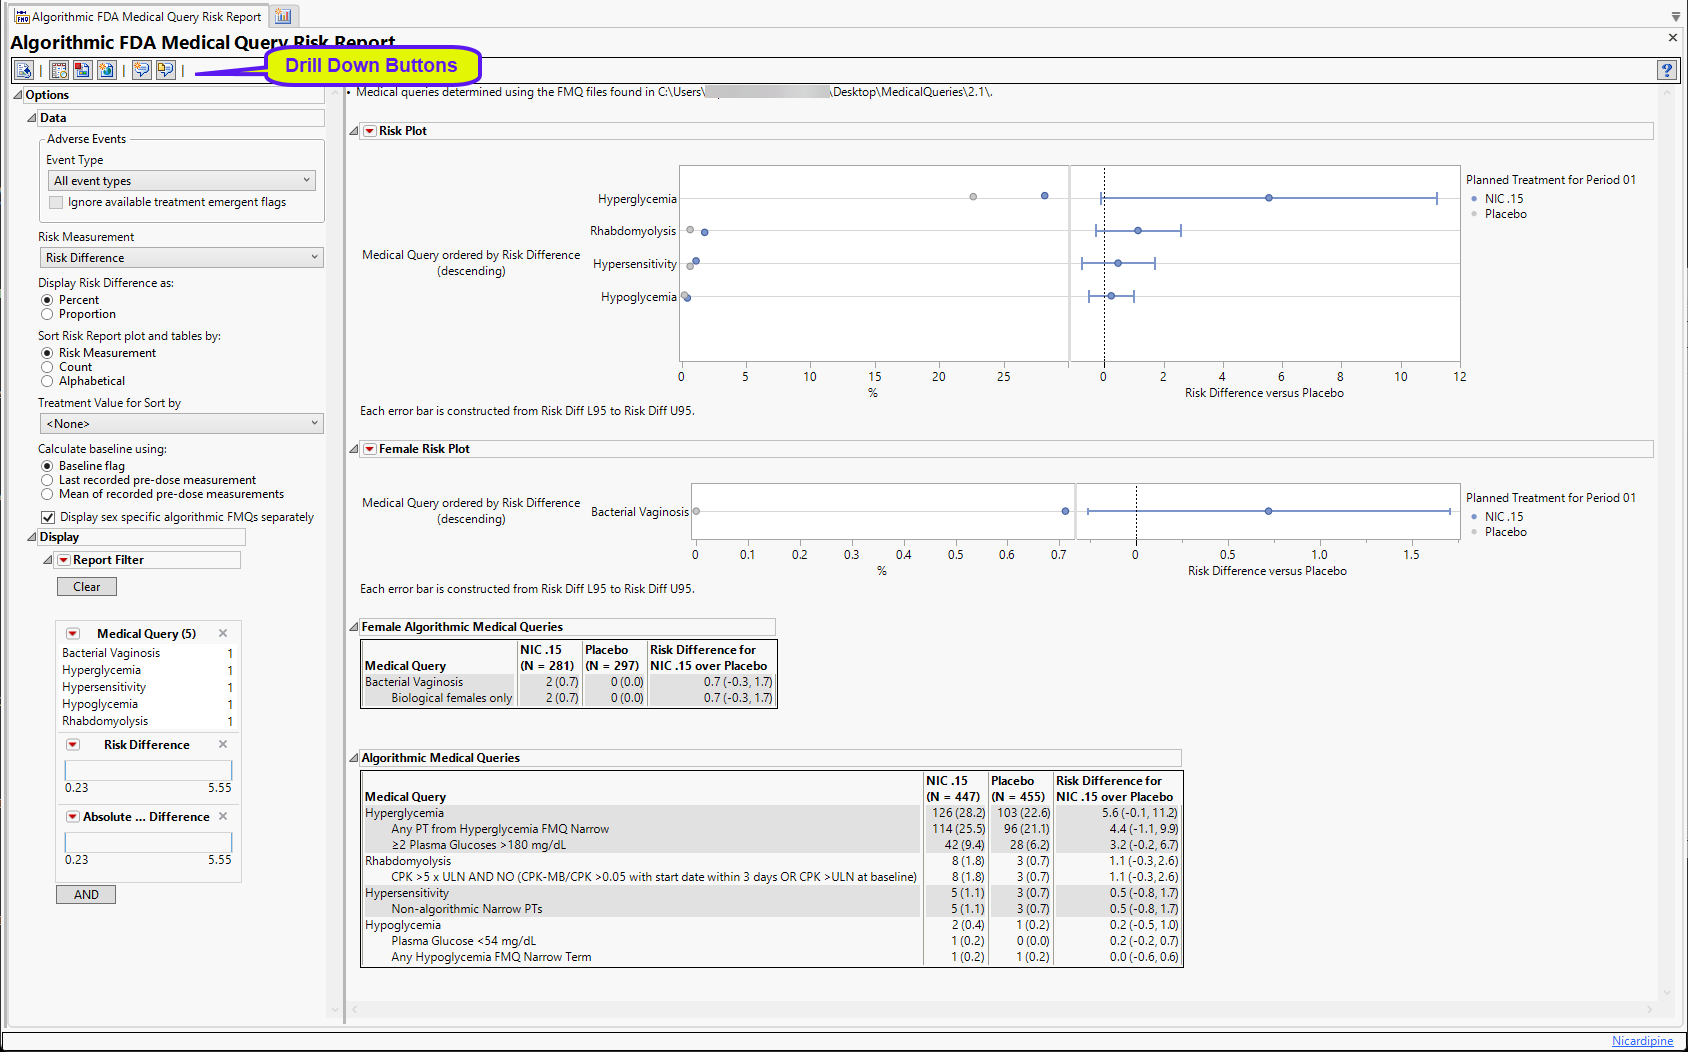
Running Algorithmic FMQ Medical Query Risk Report for a modified Nicardipine study using FMQ v2.1 files generates the Report shown below.

The Report contains the following elements:
Risk Plot
There are two plots shown here. Medical queries are shown on the y axis. The dot plot on the left of each group shows the percentile occurrence of subjects in each arm exhibiting the queries. The Forest plot on the right of each group shows the risk difference for subjects to exhibit events covered by each query.
Forest Plots display relative strength of treatment effects as horizontal lines representing the 95% confidence interval of the effect observed in that trial. The confidence interval is normally for the relative likelihood of a given nominal-level outcome for the intervention group compared to the control group. In this example, the forest plot shown below, represents the risk difference for developing the specified event relative to exposure to Nicardipine.

Sex-specific Risk Plot(s)
These plots are like the plots shown above but display sex-specific algorithmic FMQs only. They are surfaced only when the Display sex specific algorithmic FMQs separately option is checked.

In this example, a plot for female-specific algorithmic FMQs is shown. A male-specific plot would also have been shown if any of the subjects had exhibited male-specific events.
Sex-specific Algorithmic Medical Queries Table(s)
This table is like the table shown above but lists sex-specific algorithmic FMQs only. It is surfaced only when the Display sex specific algorithmic FMQs separately option is checked.

In this example, a table for female-specific algorithmic FMQs is shown. A male-specific table would also have been shown if any of the subjects had exhibited male-specific events.
Algorithmic Medical Queries Table
This table lists each query with its associated qualifications, the number (percentile) of subjects exhibiting the event by qualification, and the risk difference between the treatment arms.

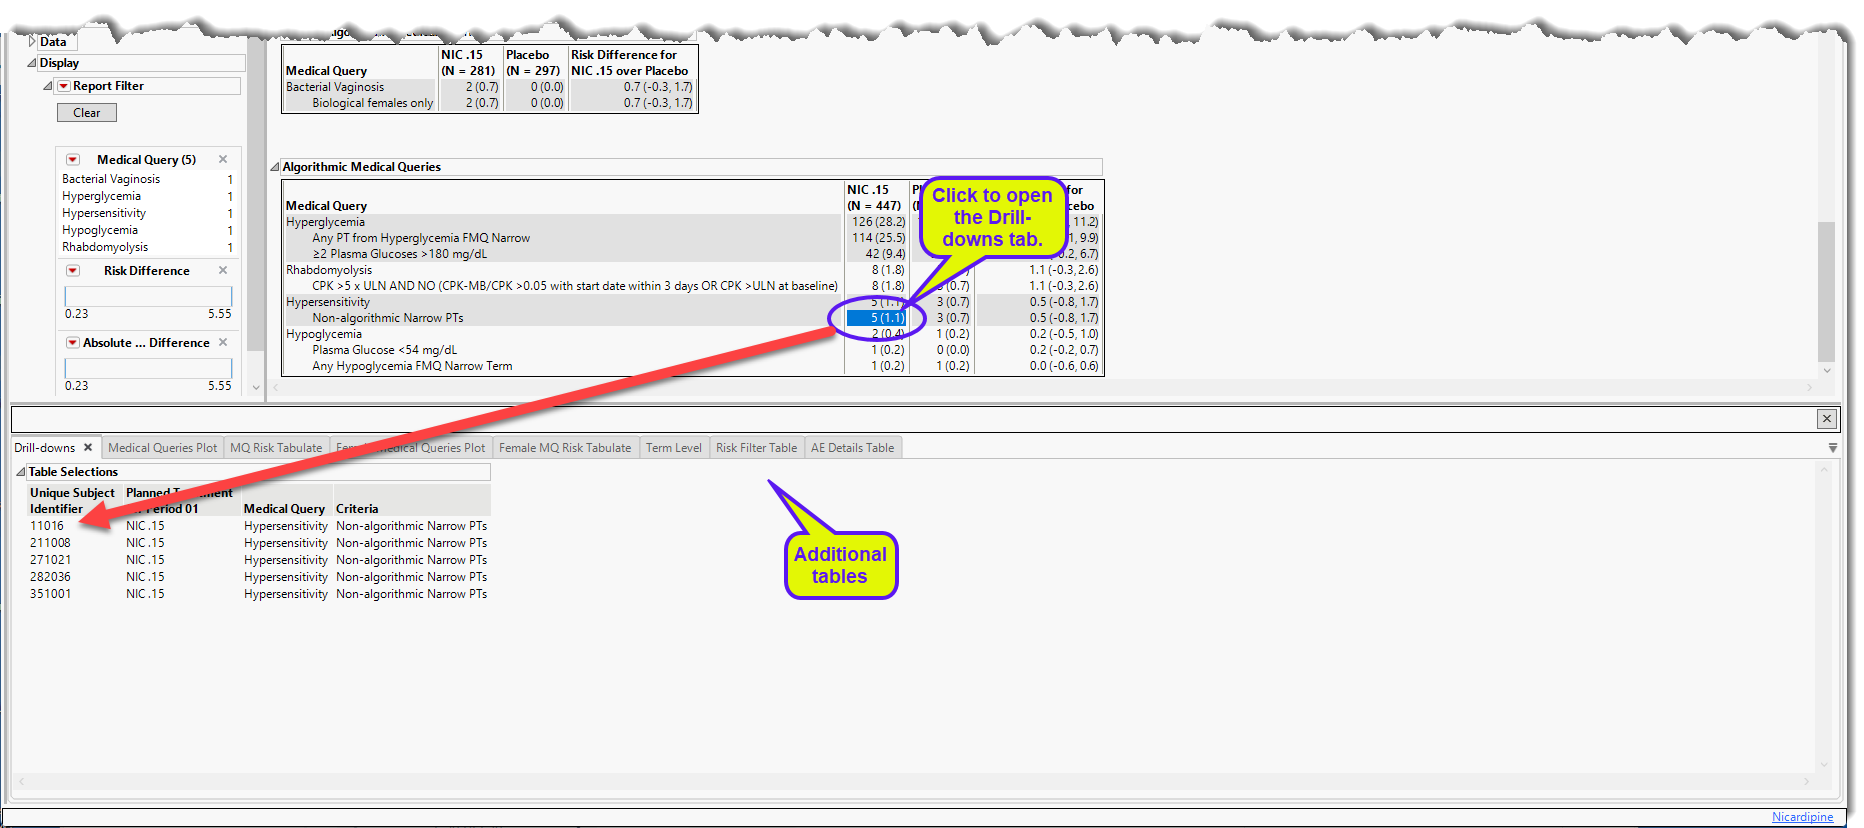
You can click on the subjects displaying specific events described by the medical queries to bring up the Drill-downs tab that provides more details about the specific subjects and medical query along with several additional tables with more details.

Options
Data

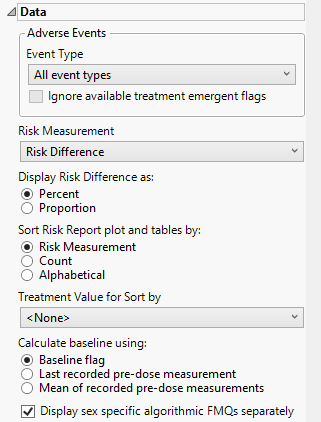
Event Type
Analysis can consider all events or only those that emerge at specific times before, during, or after the trial period. For example, selecting On treatment events as the Event Type includes only those events that occur on or after the first dose of study drug and at or before the last dose of drug (+ the offset for end of dosing).
Ignore available treatment emergent flags
If you choose to Ignore available treatment emergent flags, the analysis includes all adverse events that occur on or after day 1 of the study when the event type is Treatment emergent events.
Risk Measurement
Use the Risk Measurement, option to specify the measure you want to use for defining risk.
Display Risk Difference as:
Use this widget to specify whether to display the risk difference values as either percentages or proportions.
Sort Risk Report plot and tables by:
Use the Sort Risk Report plot and tables by: widget to specify how the rows in the Risk Report plot and tables are to be sorted.
Treatment Value for Sort by:
Use this widget to specify the treatment value to sort the plots and tables by. This is especially useful when there are multiple treatment regimes. Refer to Treatment Value for Sort by for more information.
Calculate baseline using:
Use this widget to specify how the baseline findings measurements should be calculated. Refer to Calculate baseline using: for more information.
Display sex specific algorithmic FMQs separately
Check this option to display male-specific and female specific algorithmic FMQS in separate and distinct plots and tables. When this option is unchecked, sex-specific algorithmic FMQS are included in the main plot and table.
Additional Filters
These filters let you restrict your analysis to only those subjects that meet specific criteria at the domain level. Applicable domains include Adverse Events (AE), Findings (LB), and Interventions(CM). Filters use JMP WHERE clauses to Select Rows that meet the specified criteria. To use these filters, you must enter the JSL (JMP Scripting Language) expressions that constitute the WHERE clause in the appropriate text box for specific filtering of AEs, Disposition, Findings, and/or Subjects. Note: This is an advanced concept that not only requires some basic knowledge of the JSL where clause syntax (similar to, but different from, SQL), but also an understanding of the exact variables in the tables in the study.
Note: To filter subjects with a specific event, one could also use the Subpopulation Builder on any domain of interest. For example, filter to all subjects that exhibit cardiac failure ( :Customized Query 01 Name == "Cardiac failure" ) and run all reports on those.
Report Data Filters
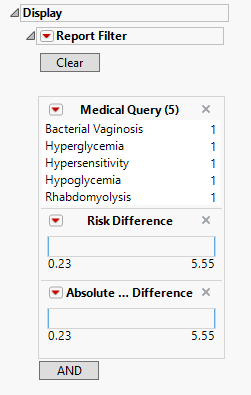
These filters enable you to subset and view subjects based on demographic characteristics and other criteria. Refer to Data Filter for more information.

General and Drill Down Buttons
Action buttons, provide you with an easy way to drill down into your data. The following action buttons are generated by this report:
| • | Click  to rerun the report using default settings. to rerun the report using default settings. |
General and Drill Down Buttons
Action buttons, provide you with an easy way to drill down into your data. The following action buttons are generated by this report:
| • | Click  to reset all report options to default settings. to reset all report options to default settings. |
| • | Click  to view the associated data tables. Refer to Show Tables/View Data for more information. to view the associated data tables. Refer to Show Tables/View Data for more information. |
| • | Click  to generate a standardized pdf- or rtf-formatted report containing the plots and charts of selected sections. to generate a standardized pdf- or rtf-formatted report containing the plots and charts of selected sections. |
| • | Click  to generate a JMP Live report. Refer to Create Live Report for more information. to generate a JMP Live report. Refer to Create Live Report for more information. |
| • | Click  to take notes, and store them in a central location. Refer to Add Notes for more information. to take notes, and store them in a central location. Refer to Add Notes for more information. |
| • | Click  to read user-generated notes. Refer to View Notes for more information. to read user-generated notes. Refer to View Notes for more information. |
Default Settings
Refer to Set Study Preferences for default Subject Level settings.
Methodology
To run this report, at least two treatment levels are needed and the treatment control level preference must not be set to None.
Patients are assessed for each medical query they experience and Percent Occurrence and Risk Difference are calculated for each query by treatment group. Percent Occurrence is simply the percentage of patients in a treatment group who experience the query at least once during the trial period. Risk difference is calculated by subtracting the number of patients exhibiting the query in the control group from the number of patients exhibiting the query in the treatment arm. Relative Risk or Odds Ratios may also be calculated.
The algorithms are taken from the excel files that include the following queries: Abnormal Uterine Bleeding, Amenorrhea, Bacterial Vaginosis, Decreased Menstrual Bleeding, Erectile Dysfunction, Excessive Menstrual Bleeding, Gynecomastia, Hyperglycemia, Hypersensitivity, Hypoglycemia, Rhabdomyolysis. Algorithms are placed into a set of three JMP tables that are used to process the queries in the report.