Clinical Events Distribution
This report captures clinical events specially tracked as being of interest to the particular study and reported in the CE domain. This report differs from other distribution reports in that it considers both Yes and No responses for occurrences.
Note: Refer to Distribution Reports for a description of the general analysis performed by the JMP Clinical distribution reports.
Note: This report is available only when the study contains a CE domain.
Report Results Description
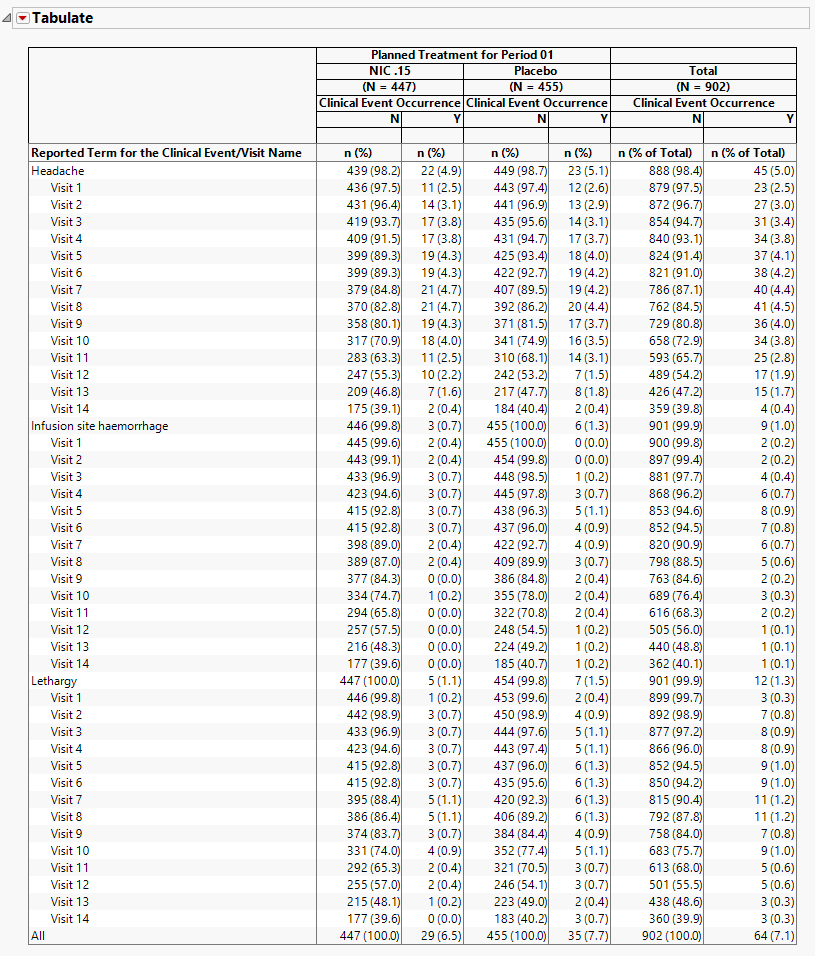
Running this report using a modified Nicardipine study and default settings generates the Report shown below.
Table
The report contains one table:

The table lists clinical events and reports their occurrence (both as counts and percentages) across individual procedures and treatment arms as well as providing total occurrences. The counts, represented by n, are the number of subjects who experienced the given clinicalevent. The first column lists the clinical event as well as the visit name, if available. Each treatment arm is split into columns for whether the clinical event occurred or not. Event terms are sorted by the totals in the Y column. Visits are then sorted in chronological order under each term.
In the event of multiple occurrences of an event, this report determines the most serious occurrence at each visit and reports that as the date of occurrence. If visit is not included for clinical events, then the report determines the most serious occurrence at the earliest date and reports that as the date of occurrence.
Options
Use the drop-downs on this panel to customize your analysis.

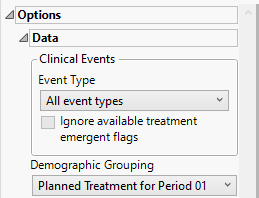
Event Type
Analysis can consider all events or only those that emerge at specific times before, during, or after the trial period. For example, selecting On treatment events as the Event Type includes only those events that occur on or after the first dose of study drug and at or before the last dose of drug (+ the offset for end of dosing).
Ignore available treatment emergent flags
If you choose to Ignore available treatment emergent flags, the analysis includes all clinical events that occur on or after day 1 of the study when the event type is Treatment emergent events.
Demographic Grouping
Results can be viewed as a whole or they can either be split out by Demographic Grouping to show different levels within each event.
Report Data Filters
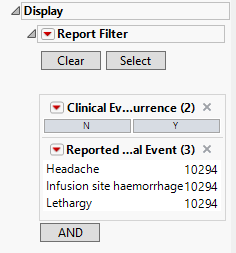
These filters enable you to subset and view subjects based on demographic characteristics and other criteria. Refer to Data Filter for more information.

Note: Filter specifications are reapplied when any widget options are changed.
General and Drill Down Buttons
Action buttons, provide you with an easy way to drill down into your data. The following action buttons are generated by this report:
| • | Click  to rerun the report using default settings. to rerun the report using default settings. |
| • | Click  to view the associated data tables. Refer to Show Tables/View Data for more information. to view the associated data tables. Refer to Show Tables/View Data for more information. |
| • | Click  to generate a standardized pdf- or rtf-formatted report containing the plots and charts of selected sections. to generate a standardized pdf- or rtf-formatted report containing the plots and charts of selected sections. |
| • | Click  to generate a JMP Live report. Refer to Create Live Report for more information. to generate a JMP Live report. Refer to Create Live Report for more information. |
| • | Click  to take notes, and store them in a central location. Refer to Add Notes for more information. to take notes, and store them in a central location. Refer to Add Notes for more information. |
| • | Click  to read user-generated notes. Refer to View Notes for more information. to read user-generated notes. Refer to View Notes for more information. |
| • | Click  to open and view the Review Subject Filter. to open and view the Review Subject Filter. |
| • | Click  to specify Derived Population Flags that enable you to divide the subject population into two distinct groups based on whether they meet very specific criteria. to specify Derived Population Flags that enable you to divide the subject population into two distinct groups based on whether they meet very specific criteria. |
Default Settings
Refer to Set Study Preferences for default Subject Level settings.
Methodology
No testing is performed. Analysis is restricted to tabulating counts/percentages of subjects experiencing clinical events.