Mortality Time to Event
Mortality Time-to-Event groups clinical mortality results by treatment arm and generates Kaplan-Meier survival curves with associated statistics.
Report Results Description
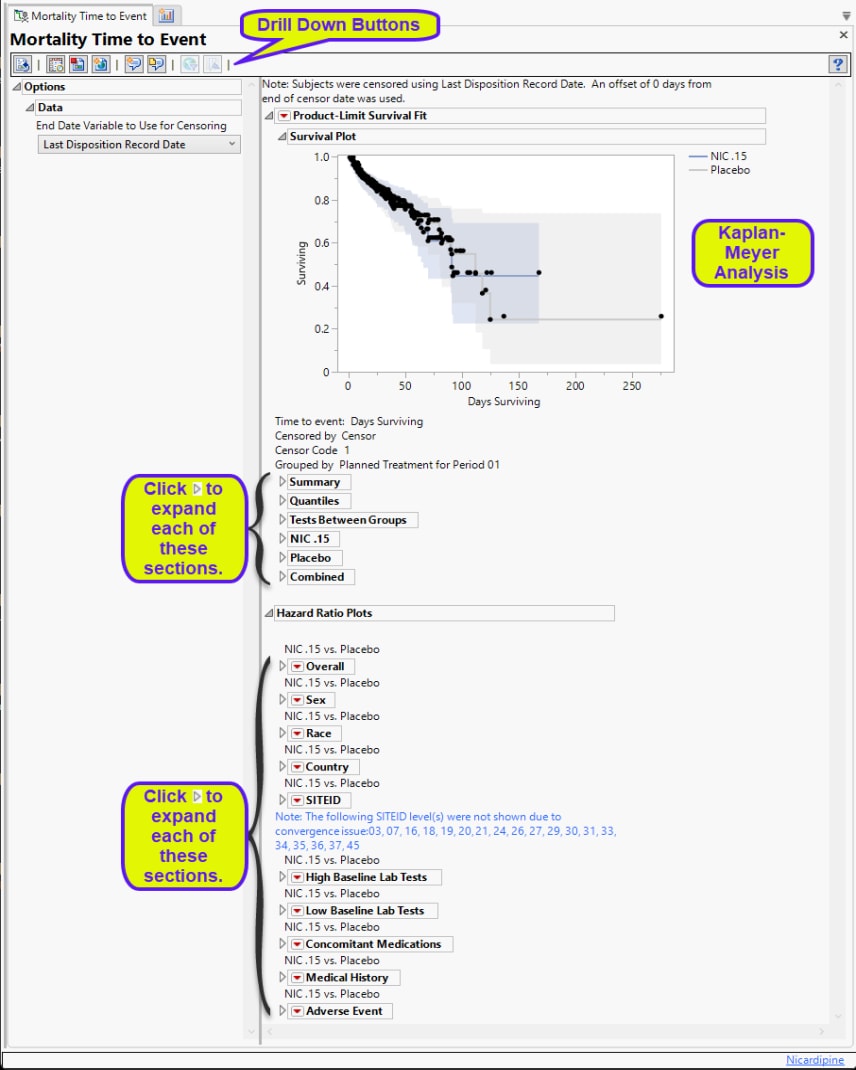
Running this report for Nicardipine using default settings generates the report shown below.

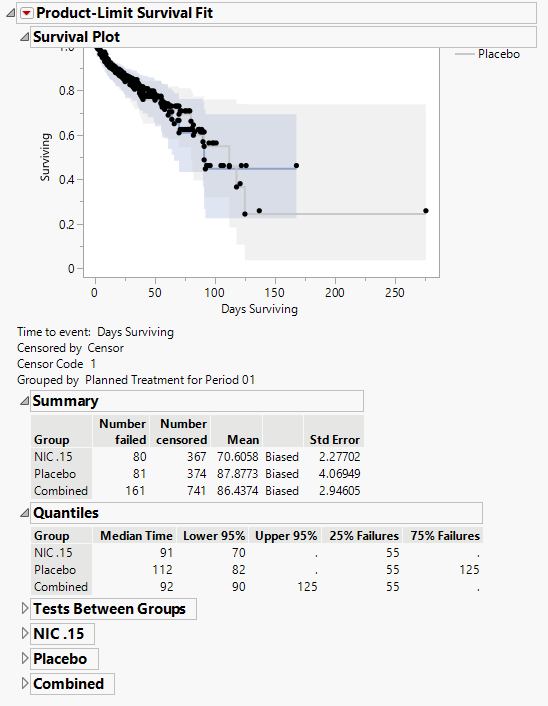
Product-Limit Survival Fit
Contains a Kaplan-Meier time-to-event analysis and associated statistics
| • | One Survival Plot. |
This analysis compares the time until the last disposition record. Otherwise, subjects are censored at the reference end date (RFENDTC).

See Survival Plot for more information.
| • | Summary Statistics |
Contains tables of summary statistics for the survival of the study subjects.
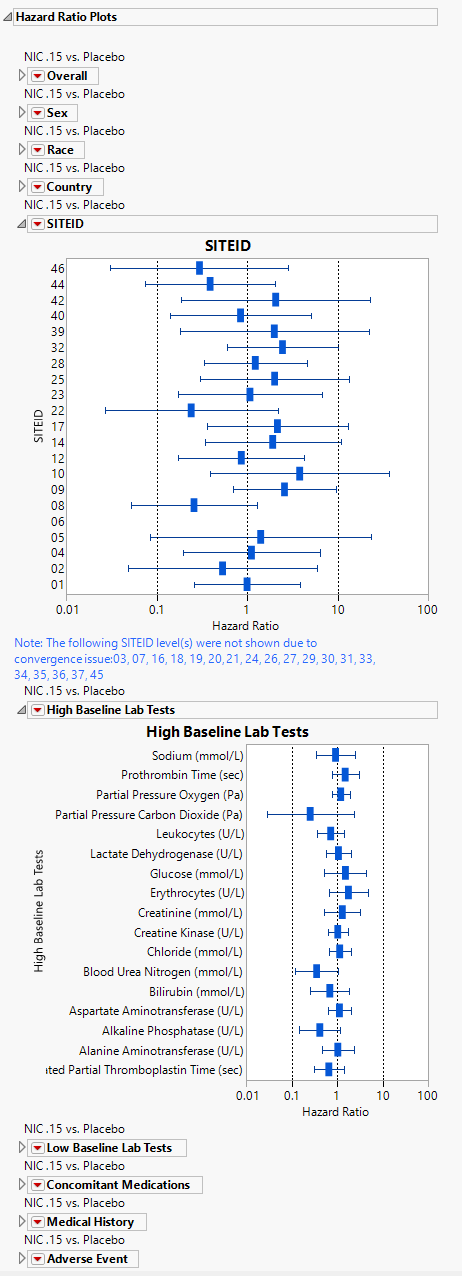
Hazard Ratio Plots
Displays Hazard Ratio Event Plots with 95% confidence intervals for each of the following demographic subgroups: overall, gender, race, country, study site identifier, high and low baseline lab teats, concomitant medications, medical history, and adverse events.

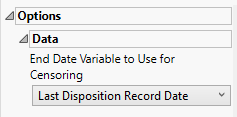
Options
Data

End Date Variable to Use for Censoring
Use the End Date Variable to Use for Censoring option for specifying the end date for censoring. Options include the reference end date (selected by default), date of the last treatment, or the date of the last disposition record.
General and Drill Down Buttons
Action buttons, provide you with an easy way to drill down into your data. The following action buttons are generated by this report:
| • | Click  to rerun the report using default settings. to rerun the report using default settings. |
| • | Click  to view the associated data tables. Refer to Show Tables/View Data for more information. to view the associated data tables. Refer to Show Tables/View Data for more information. |
| • | Click  to generate a standardized pdf- or rtf-formatted report containing the plots and charts of selected sections. to generate a standardized pdf- or rtf-formatted report containing the plots and charts of selected sections. |
| • | Click  to generate a JMP Live report. Refer to Create Live Report for more information. to generate a JMP Live report. Refer to Create Live Report for more information. |
| • | Click  to take notes, and store them in a central location. Refer to Add Notes for more information. to take notes, and store them in a central location. Refer to Add Notes for more information. |
| • | Click  to read user-generated notes. Refer to View Notes for more information. to read user-generated notes. Refer to View Notes for more information. |
| • | Click  to open and view the Review Subject Filter. to open and view the Review Subject Filter. |
| • | Click  to specify Derived Population Flags that enable you to divide the subject population into two distinct groups based on whether they meet very specific criteria. to specify Derived Population Flags that enable you to divide the subject population into two distinct groups based on whether they meet very specific criteria. |
By default, time is measured in days. However, you can change the Time Scale to measure time in weeks. This option is useful for assessing report graphics for exceptionally long studies.
You can opt to assess interventions across the entire study (specified by default). Alternatively, you can specify a and an End Time to restrict the analysis to a specific time interval.
Default Settings
Refer to Set Study Preferences for default Subject Level settings.
Methodology
Deaths are determined using records from the disposition dataset where the term (DSDECOD) is either DEATH, DEAD, or DIED and the study day (DSSTDY) is greater than or equal to 1. Subjects with missing censor date information are removed from the analysis. Notes are displayed at the top of the report for what censor date variable is used and how many subjects were removed due to missing censor date information.
To produce the hazard ratios, the preference for control level must be set to a level other than None. Any subgroups in the hazard ratios that cause a convergence issue are removed from the analysis and a note is displayed under the plots for which subgroups were removed.