Output Description
Local Control
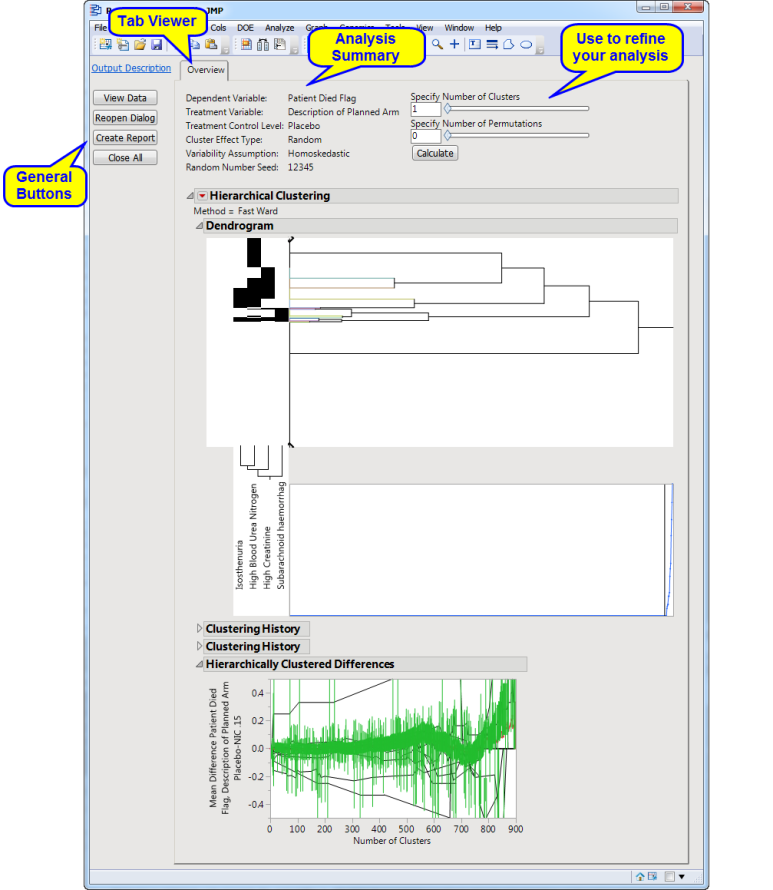
Running this process using the Nicardipine _patient_died sample setting generates the tabbed Results window shown below. Refer to the Local Control process description for more information. Output from the process is organized into tabs. Each tab contains one or more plots, data panels, data filters, and other elements that facilitate your analysis.

The Results window contains the following panes:
Tab Viewer
This pane provides you with a space to view individual tabs within the Results window. Use the tabs to access and view the output plots and associated data sets.
The following tab is generated by this process:
| • | Overview: Contains a summary of analysis specifications and the initial results. |
You can use the sliders to adjust the number of cluster and permutations to customize your analysis.
First, study the hierarchical cluster analysis to decide on a suitable number of clusters. Either enter this number in the text box or use the slider at the top right and click . A new tab of results is created with detailed analyses for that number of clusters. Repeat using different numbers of clusters to determine how results change.
Once you have a number of clusters that appears promising, enter a number of permutations and click in order to perform a permutation-based analysis. Repeat as desired.
General
| • | Click to surface the data sets corresponding to the active tab. |
| • | Click to reopen the completed process dialog used to generate this output. |
| • | Click to generate a pdf- or rtf-formatted report containing the plots and charts of selected tabs. |
| • | Click to close all graphics windows and underlying data sets associated with the output. |