Variable Weights

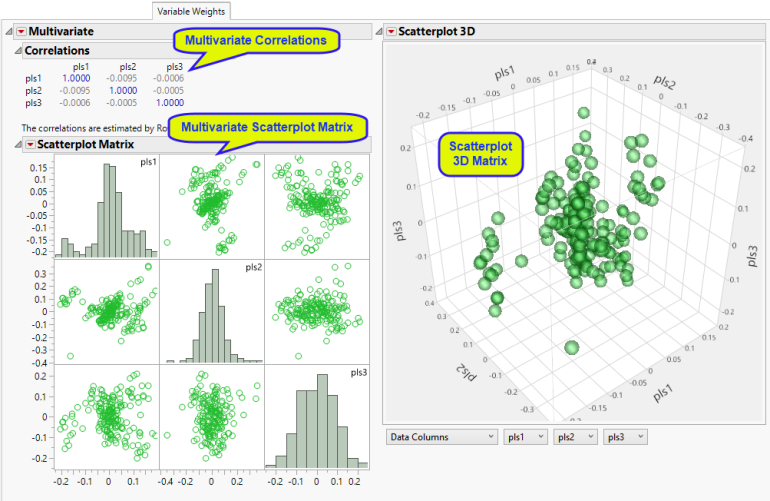
The Variable Weights tab contains the following elements:
| • | Multivariate Correlations |
These are Pearson correlations between the variable weights, which are scores on the predictors. The correlations are typically zero between the second and higher components, depending on the centering of the predictors.
| • | Multivariate Scatterplot Matrix |
This plots the variable weights against each other, colored by the dependent variables. There is one weight for each predictor. Larger weights generally indicate predictors with more influence in the model, although they depend on the original scaling of the predictors.
You can use these plots to identify predictors associated with classification performance. They can also reveal hidden structure in the data similar to principal components, but these components accommodate the values of the dependent variable.
See Scatterplot Matrix for more information.
| • | Scatterplot 3D Matrix |
This plots the first three sets of variable weights against each other in a three-dimensional scatterplot, colored by the dependent variables. Models that predict the categories well exhibit separation of points into clusters. Click and drag the mouse to spin the plot.
You can use this plot to identify point predictors associated with classification performance. They can also reveal hidden structure in the data similar to principal components, but these components accommodate the values of the dependent variable.
See Three-Dimensional Scatterplot for more information.