|
ASYCORR
|
|
•
|
Displays asymptotic correlation matrix of covariance parameter estimates. It is computed from the corresponding asymptotic covariance matrix (see the description of the ASYCOV option, below) |
|
|
ASYCOV
|
|
•
|
This option requests that the asymptotic covariance matrix of the covariance parameters be displayed. By default, this matrix is the observed inverse Fisher information matrix, which equals 2H-1, where H is the Hessian (second derivative) matrix of the objective function. |
|
|
COVTEST
|
|
•
|
Displays asymptotic standard errors and Wald tests for covariance parameters |
|
|
EMPIRICAL
|
|
•
|
Computes the estimated variance-covariance matrix of the fixed-effects parameters by using the asymptotically consistent (or sandwich) estimator. |
|
|
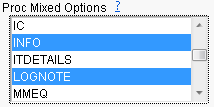
IC
|
|
•
|
Displays a table of information criteria. |
|
|
INFO
|
|
•
|
Displays additional tables of model, dimensional and other information. |
|
|
ITDETAILS
|
|
•
|
Displays the parameter values at each iteration and enables the writing of notes to the SAS log pertaining to infinite likelihood and singularities during Newton-Raphson iterations. |
|
|
LOGNOTE
|
|
•
|
Writes periodic notes to the SAS log describing the current status of computations. |
|
•
|
Note: This option was designed for use with analyses requiring extensive CPU resources. |
|
|
METHOD=MIVQUE0
|
|
•
|
Specify this option to perform minimum quadratic unbiased estimation of the covariance parameters. |
|
|
METHOD=TYPE1
|
|
•
|
When you select this option, an analysis of variance table is included in the output, and the expected mean squares are used to estimate the variance components. (See The GLM Procedure for further explanation.)The resulting method-of-moment variance component estimates are used in subsequent calculations, including Type 1 standard errors computed from ESTIMATE and LSMEANS statements. |
|
•
|
Note: This option applies only to variance component models with no SUBJECT= effects and no REPEATED statement. |
|
|
METHOD=TYPE2
|
|
•
|
When you select this option, an analysis of variance table is included in the output, and the expected mean squares are used to estimate the variance components. (See The GLM Procedure for further explanation.) The resulting method-of-moment variance component estimates are used in subsequent calculations, including Type 2 standard errors computed from ESTIMATE and LSMEANS statements. |
|
•
|
Note: This option applies only to variance component models with no SUBJECT= effects and no REPEATED statement. |
|
|
METHOD=TYPE3
|
|
•
|
When you select this option, an analysis of variance table is included in the output, and the expected mean squares are used to estimate the variance components. (See The GLM Procedure for further explanation.) The resulting method-of-moment variance component estimates are used in subsequent calculations, including Type 3 standard errors computed from ESTIMATE and LSMEANS statements. |
|
•
|
Note: This option applies only to variance component models with no SUBJECT= effects and no REPEATED statement. |
|
|
MMEQ
|
|
•
|
Requests that coefficients of the mixed modelequations be displayed. |
|
|
MMEQSOL
|
|
•
|
Requests that a solution to the mixed model equations be produced, as well as the inverted coefficients matrix. |
|
|
NOBOUND
|
|
•
|
Requests the removal of boundary constraints on covariance parameters. |
|
•
|
For example, variance components have a default lower boundary constraint of 0, and the NOBOUND option allows their estimates to be negative. |
|
|
NOCLPRINT
|
|
•
|
Suppresses the display of the Class Level Information table if you do not specify number. |
|
•
|
If you do specify number, only levels with totals that are less than number are listed in the table. |
|
|
NOITPRINT
|
|
•
|
Suppresses the display of the Iteration History table. |
|
|
NOPROFILE
|
|
•
|
Includes the residual variance as part of the Newton-Raphson iterations. |
|
•
|
This option applies only to models that have a residual variance parameter. |
|
•
|
By default, this parameter is profiled out of the likelihood calculations. |
|
|
ORD
|
|
•
|
Displays ordinates of the relevant distribution in addition to p-values. The ordinate can be viewed as an approximate odds ratio of hypothesis probabilities. |
|

