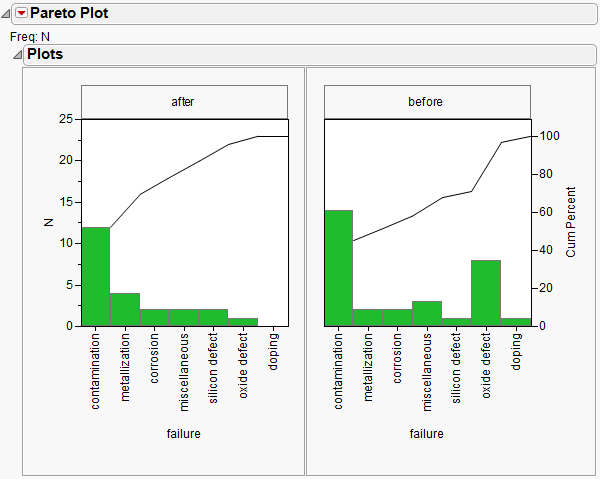
This example uses the Failure2.jmp sample data table. This table records failures in a sample of capacitors manufactured before cleaning a tube in the diffusion furnace and in a sample manufactured after cleaning the furnace. For each type of failure, the variable clean identifies the samples with the values “before” or “after.”
|
1.
|
|
2.
|
|
3.
|
|
4.
|
|
5.
|
|
6.
|
Click OK.
|
Figure 11.14 displays the side-by-side plots for each value of the variable, clean.
Figure 11.14 One-way Comparative Pareto Plot
The horizontal and vertical axes are scaled identically for both plots. The bars in the first plot are in descending order of the y-axis values and determine the order for all cells.
|
7.
|
Rearrange the order of the plots by clicking the title (after) in the first tile and dragging it to the title of the next tile (before).
|
A comparison of these two plots shows a reduction in oxide defects after cleaning. However, the plots are easier to interpret when presented as the before-and-after plot shown in Figure 11.15. Note that the order of the causes changes to reflect the order based on the first cell.
Figure 11.15 One-way Comparative Pareto Plot with Reordered Cells

