JMP 14.1 Online Documentation (English)
Discovering JMP
Using JMP
Basic Analysis
Essential Graphing
Profilers
Design of Experiments Guide
Fitting Linear Models
Predictive and Specialized Modeling
Multivariate Methods
Quality and Process Methods
Reliability and Survival Methods
Consumer Research
Scripting Guide
JSL Syntax Reference
JMP iPad Help
JMP Interactive HTML
Capabilities Index
JMP 13 Online Documentation
JMP 12 Online Documentation
Quality and Process Methods •
Process Capability
•
Process Capability Platform Options
• Summary Reports
Previous
•
Next
Summary Reports
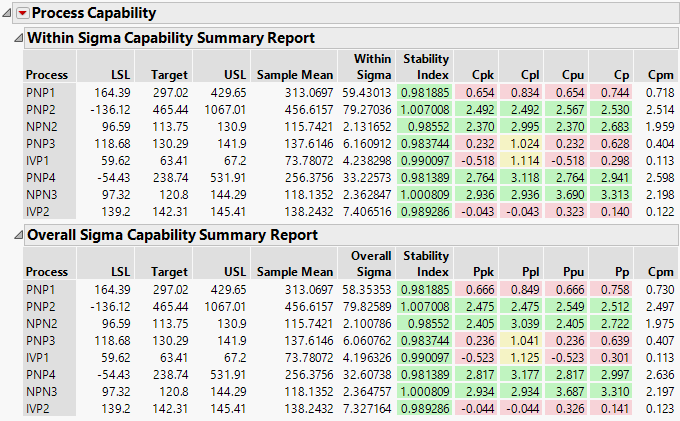
The Summary Report options show or hide a table that contains the following statistics for each variable: LSL, Target, USL, Sample Mean, various Sigma estimates, Stability Index, Cpk, Cpl, Cpu, Cp, Cpm, and Nonconformance statistics. These statistics are calculated using the sigma estimate specified in the report title. The columns for Stability Index, Cpk, Cpl, Cpu, and Cp are colored as green, yellow, and red to indicate adequate, marginal, and poor stability or capability. This color coding scheme matches what you would see in the Process Performance graph.
Note:
You can change the preferences for stability assessment type in File > Preferences > Platforms > Process Capability. This changes the stability assessment type used through the Process Capability platform.
Figure 10.19
shows a subset of columns for both summary reports as described in
Example of the Process Capability Platform with Normal Variables
. The following optional columns are available for this report:
•
Confidence intervals for Cpk, Cpl, Cpu, CP, and Cpm
•
Expected and observed PPM statistics (outside, below LSL, above USL)
Note:
The expected PPM statistics are the percentages you would expect to see based on the distribution chosen. By default, the distribution is normal. The observed PPM statistics are the percentages based on the actual data.
•
Sample standard deviation
•
The sample size (N), the minimum, and the maximum.
To reveal these optional columns, right-click on the report and select the column names from the Columns submenu.
Note that the report (based on overall sigma) shows the overall capability indices Ppk, Ppl, Ppu, and Pp instead of the within capability indices Cpk, Cpl, Cpu, and Cp. The labeling of the overall capability indices depends on the setting of the AIAG (Ppk) Labeling preference.
Figure 10.19
Within Sigma and Overall Sigma Capability Summary Reports
Previous
•
Next
Help created on 10/11/2018