|
1.
|
|
2.
|
Select Analyze > Clustering > Normal Mixtures
|
|
3.
|
|
4.
|
Click OK.
|
|
5.
|
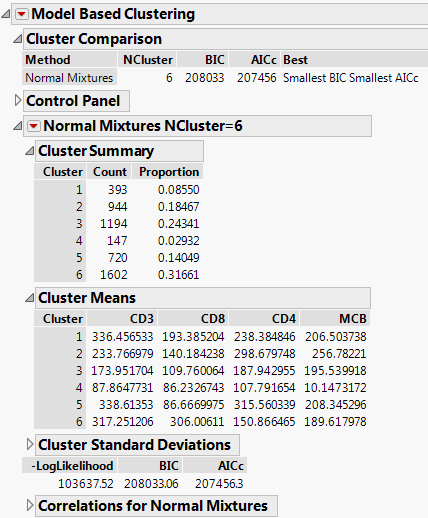
Enter 6 next to Number of Clusters.
|
|
6.
|
Click Go.
|
Figure 13.2 Normal Mixtures NCluster=6 Report
Figure 13.3 3D Biplot of Cytometry Data

