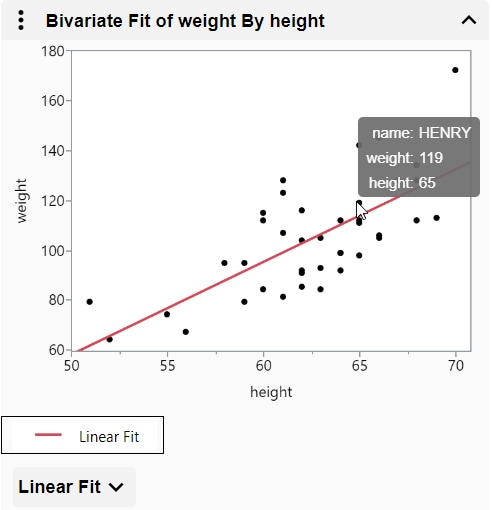
Figure 1.1 See a Data Point’s Values
Figure 1.2 See an Explanation of a P-Value Calculation
|
Press Alt and double-click in the graph, or click More
 or or  > Reset all axes. > Reset all axes. |
Double-tap in the graph, or tap More
 > Reset all axes. > Reset all axes. |
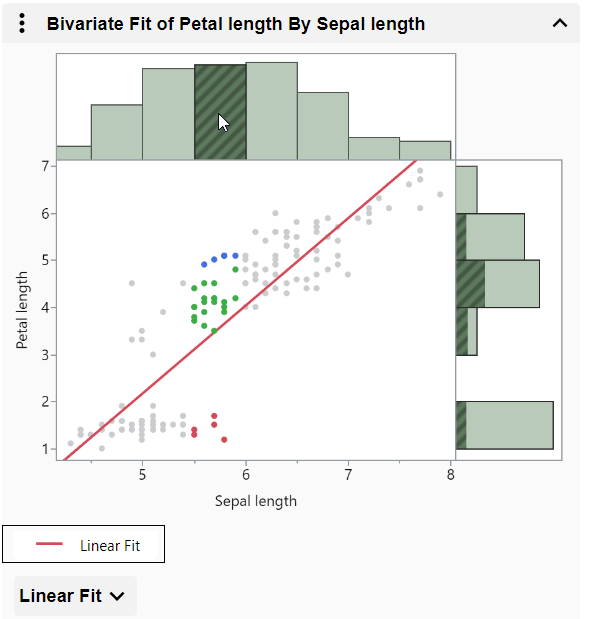
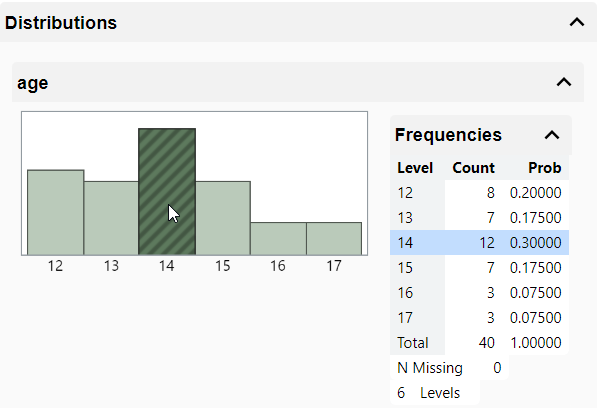
Figure 1.3 Select Data in Linked Graphs
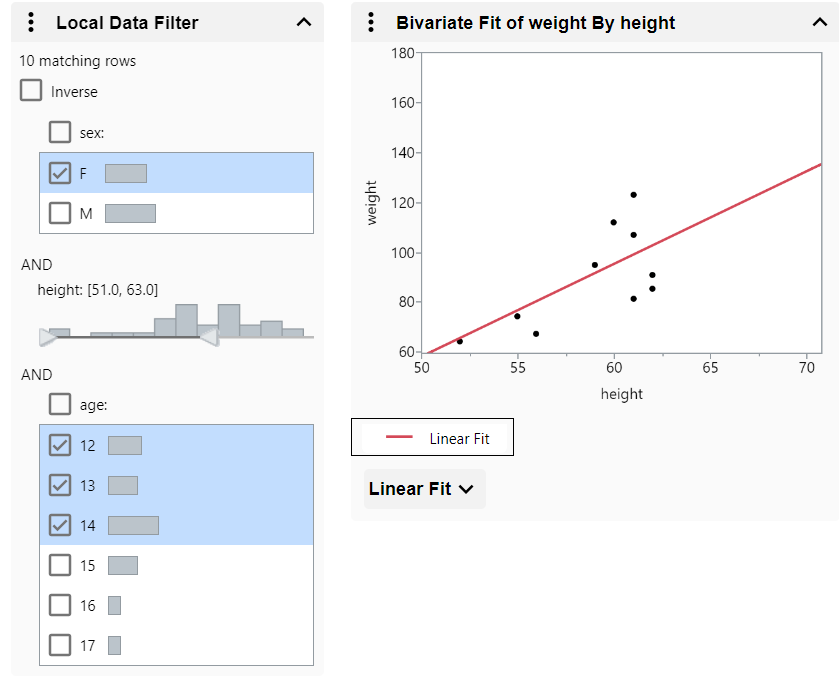
Figure 1.5 Filter Data in Graphs
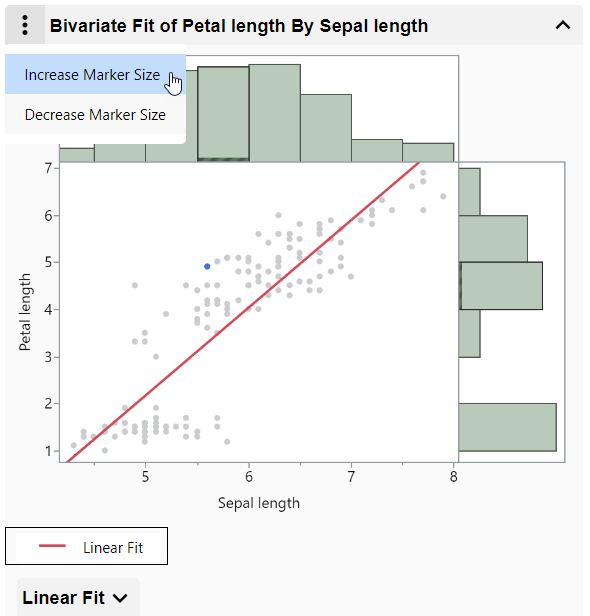
Figure 1.6 Change the Marker Size
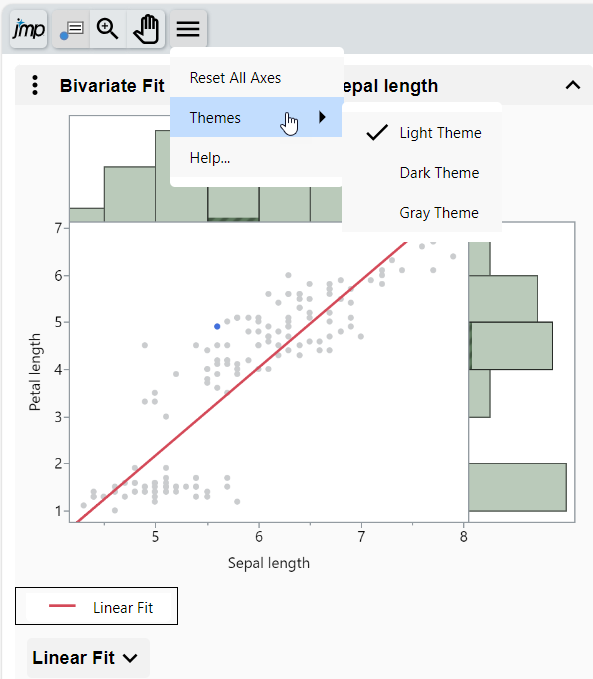
Figure 1.7 Change the Interactive HTML Page Theme
 .
.

 .
. then tap a data point.
 then tap multiple data points.