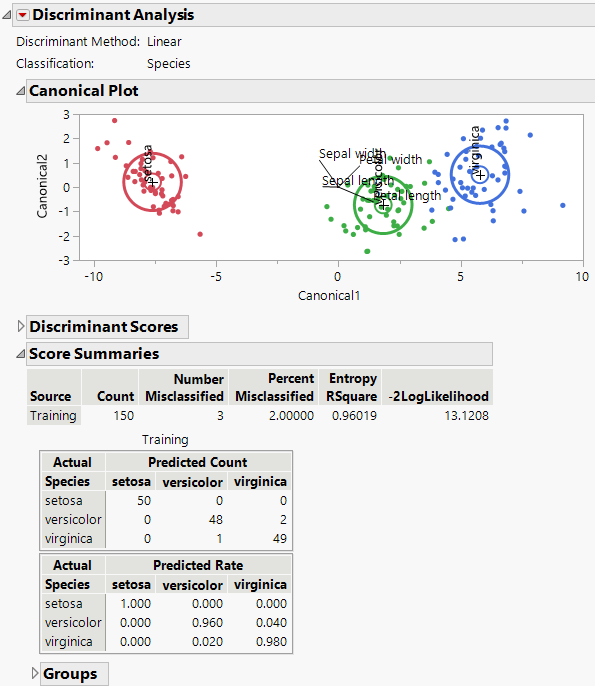
Discriminant Analysis Report
The Discriminant Analysis report provides discriminant results based on your selected Discriminant Method. The Discriminant Method and the Classification variable are shown at the top of the report. If you selected the Regularized method, its associated parameters are also shown.
You can change Discriminant Method by selecting the option from the Discriminant Analysis red triangle menu. The results in the report update to reflect the selected method.
Figure 5.6 Example of a Discriminant Analysis Report
The default Discriminant Analysis report contains the following sections:
• When you select the Wide Linear discriminant method, a Principal Components report appears. See Principal Components.
• The Canonical Plot shows the points and multivariate means in the two dimensions that best separate the groups. See Canonical Plot and Canonical Structure.
• The Discriminant Scores report provides details about how each observation is classified. See Discriminant Scores.
• The Score Summaries report provides an overview of how well observations are classified. See Discriminant Scores.
