 Example of Naive Bayes
You want to construct a classification model to be used in predicting the disease progression for future patients as High or Low. You have baseline medical data for 442 diabetic patients. You also have a binary measure of diabetes disease progression obtained one year after each patient’s initial visit. This measure quantifies disease progression as being either Low or High.
1. Select Help > Sample Data Folder and open Diabetes.jmp.
2. Select Analyze > Predictive Modeling > Naive Bayes.
3. Select Y Binary and click Y, Response.
4. Select Age through Glucose and click X, Factor.
5. Select Validation and click Validation.
6. Click OK.
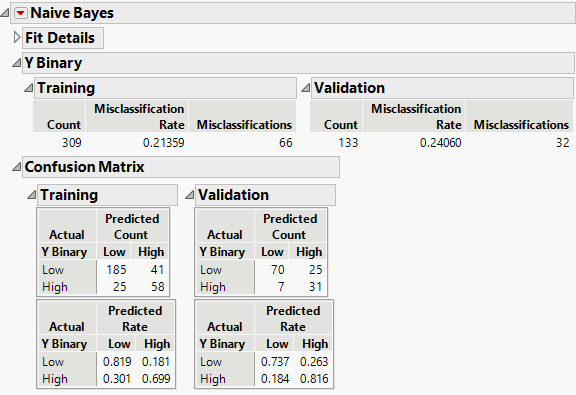
Figure 8.2 Naive Bayes Report
The Training Set has about a 21% misclassification rate and the Validation Set has about a 24% misclassification rate. The Confusion matrix suggests that, for both the Training and Validation sets, the larger source of misclassification comes from classifying patients with Low disease progression as having High disease progression. The Validation set results indicate how your model extends to independent observations.
You are interested in which individual predictors have the greatest impact on the naive Bayes classification.
7. Click the Naive Bayes red triangle and select Profiler.
Figure 8.3 Prediction Profiler for Disease Progression
8. Click the Prediction Profiler red triangle and select Assess Variable Importance > Independent Uniform Inputs.
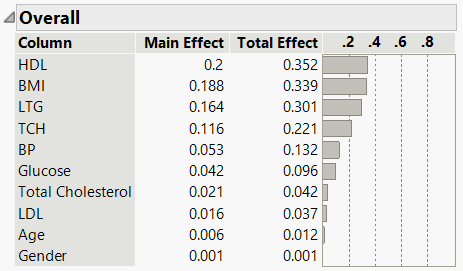
Figure 8.4 Variable Importance
The Summary Report indicates that HDL, BMI, and LTG have the greatest impact on the estimated probabilities.
Figure 8.5 Marginal Model Plots Report
The second row of plots in the Marginal Model Plots report shows that higher values of HDL are associated with a lower probability of classifying a patient as High. Also, higher BMI and LTG values are associated with a higher probability of classifying a patient as High.


