Publication date: 05/05/2023
Example of the EWMA Control Chart Platform
In this example, you are interested in detecting a shift in the gap between the ends of manufactured metal clips. To monitor the process for a change in the average gap, subgroup samples of five clips have been measured daily.
1. Select Help > Sample Data Folder and open Quality Control/Clips1.jmp.
2. Select Analyze > Quality and Process > Control Chart > EWMA Control Chart.
3. Select Gap and click Y.
4. Select Sample and click Subgroup.
5. Click OK.
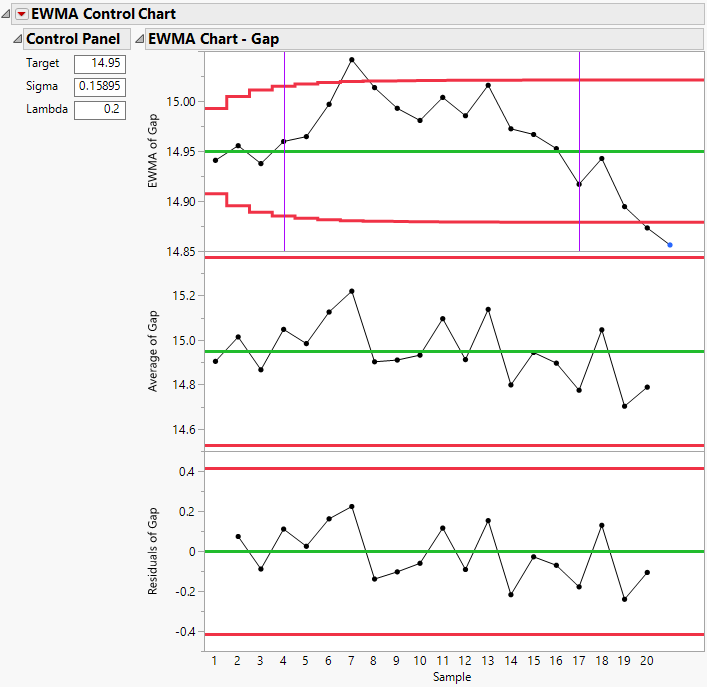
Figure 11.2 EWMA Control Chart
Purple vertical lines in the EWMA chart denote shifts. Shift starts are detected at samples 4 and 17.
Want more information? Have questions? Get answers in the JMP User Community (community.jmp.com).
