Example of the Robust Fit Option
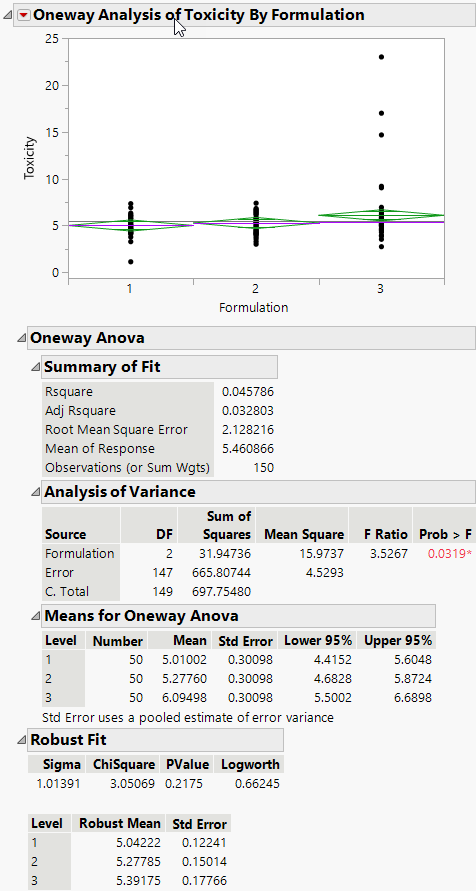
Use the Oneway platform with a robust fit in this example where one of three groups contains outliers. The data contain the toxicity levels for three different formulations of a drug.
1. Select Help > Sample Data Folder and open Drug Toxicity.jmp.
2. Select Analyze > Fit Y by X.
3. Select Toxicity and click Y, Response.
4. Select Formulation and click X, Factor.
5. Click OK.
6. Click the Oneway Analysis red triangle menu and select Means/Anova.
7. Click the Oneway Analysis red triangle menu and select Robust > Robust Fit.
Figure 6.28 Example of Robust Fit
If you look at the standard Analysis of Variance report, you might conclude that there is a difference between the three formulations, since the p-value is 0.0319. However, when you look at the Robust Fit report, you would not conclude that the three formulations are significantly different, because the p-value there is 0.2175. It appears that the toxicity for a few of the observations is unusually high, creating the undue influence on the data.
