Examples of Creating Subsets
If you want to look closely at only part of your data table, you can create a subset. For example, suppose that you have already compared the sales and profits of big, medium, and small computer and pharmaceutical companies. Now you want to look at the sales and profits of only the medium-sized companies.
Creating a subset is a two-step process. First select the target data, and then extract the data into a new table.
Subset with the Subset Command
1. Select Help > Sample Data Folder and open Companies.jmp.
Selecting the Rows and Columns That You Want to Subset
2. Select Rows > Row Selection > Select Where.
3. Select Size Co in the column list box on the left.
4. Enter medium in the text enter box.
5. Click OK.
6. Press Ctrl and select the Type, Sales ($M), and Profits ($M) columns.
Creating the Subset Table
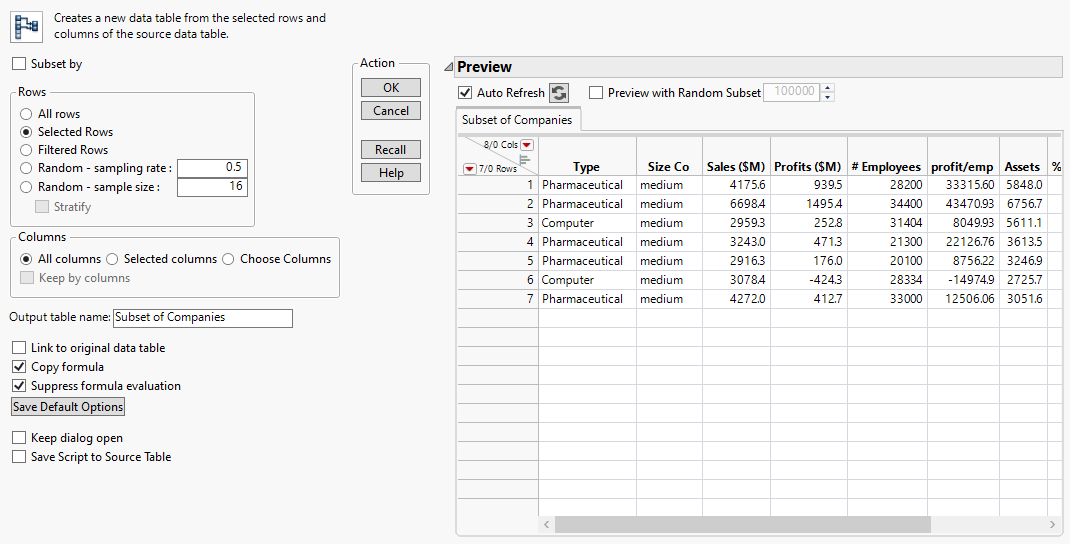
7. Select Tables > Subset to launch the Subset window.
Figure 3.26 Subset Window
8. Select Selected columns to subset only the columns that you selected. You can also customize your subset table further by selecting additional options.
9. Click OK.
The resulting subset data table has seven rows and three columns. For more information about the Subset command, see Create a Subset Data Table in Using JMP.
Subset with the Distribution Platform
Another way to create subsets uses the connection between platform results and data tables.
Example of Creating a Subset Using the Distribution Command
1. Select Help > Sample Data Folder and open Companies.jmp.
2. Select Analyze > Distribution.
3. Select Type and click Y, Columns.
4. Click OK.
5. Double-click the histogram bar that represents Computer to create a subset table of the Computer companies.
Caution: This method creates a linked subset table. This means if you make any changes to the data in the subset table, the corresponding value changes in the source table.
