Misclassification Probabilities
In the Variability Chart platform, you can analyze observations that have been misclassified based on the lower and upper tolerance limits. When you select the Misclassification Probabilities option, you are prompted to select the model type if you have not already done so.
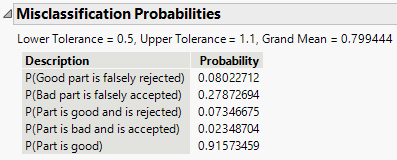
Figure 6.9 Example of the Misclassification Probabilities Report
The misclassification probabilities are based on the joint probability function of Y, the measured value of the part, and X, the true value of the part. The joint probability density function used is a bivariate normal distribution. To understand the descriptions, define the following probabilities:
δ = P[(LSL ≤ X ≤ USL) and (Y < LSL or Y > USL)]
β = P[(X < LSL or X > USL) and (LSL ≤ Y ≤ USL)]
π = P(LSL ≤ X ≤ USL)
Descriptions
P(Good part is falsely rejected)
The conditional probability that a part is rejected given that it is a good part, or δ/π.
P(Bad part is falsely accepted)
The conditional probability that a part is accepted given that it is a bad part, or β/(1-π).
P(Part is good and is rejected)
The joint probability that a part is good and that it is rejected, or δ.
P(Part is bad and is accepted)
The joint probability that a part is bad and that it is accepted, or β.
P(Part is good)
The probability that a part is good, or π.
For more information, see Statistical Details for the Misclassification Probabilities as well as Burdick et al. (2005).
