Rearrange Files in Projects
In a JMP project, data tables and reports appear in individual tabs. You can rearrange tabs by dragging them into a dock zone.
Tip: To undo or redo a docked item, select Project > Undo Layout or Project > Redo Layout. To return all tables and reports to individual tabs, select Project > Reset Layout.
Example of Rearranging Project Files
1. Select File > New > Project (Windows) or File > New > New Project (macOS).
2. Select Help > Sample Data Folder and open Car Physical Data.jmp and Car Poll.jmp.
3. In the Car Poll.jmp data table, run the Distribution script.
4. In the Car Physical Data.jmp data table, run the Contingency script.
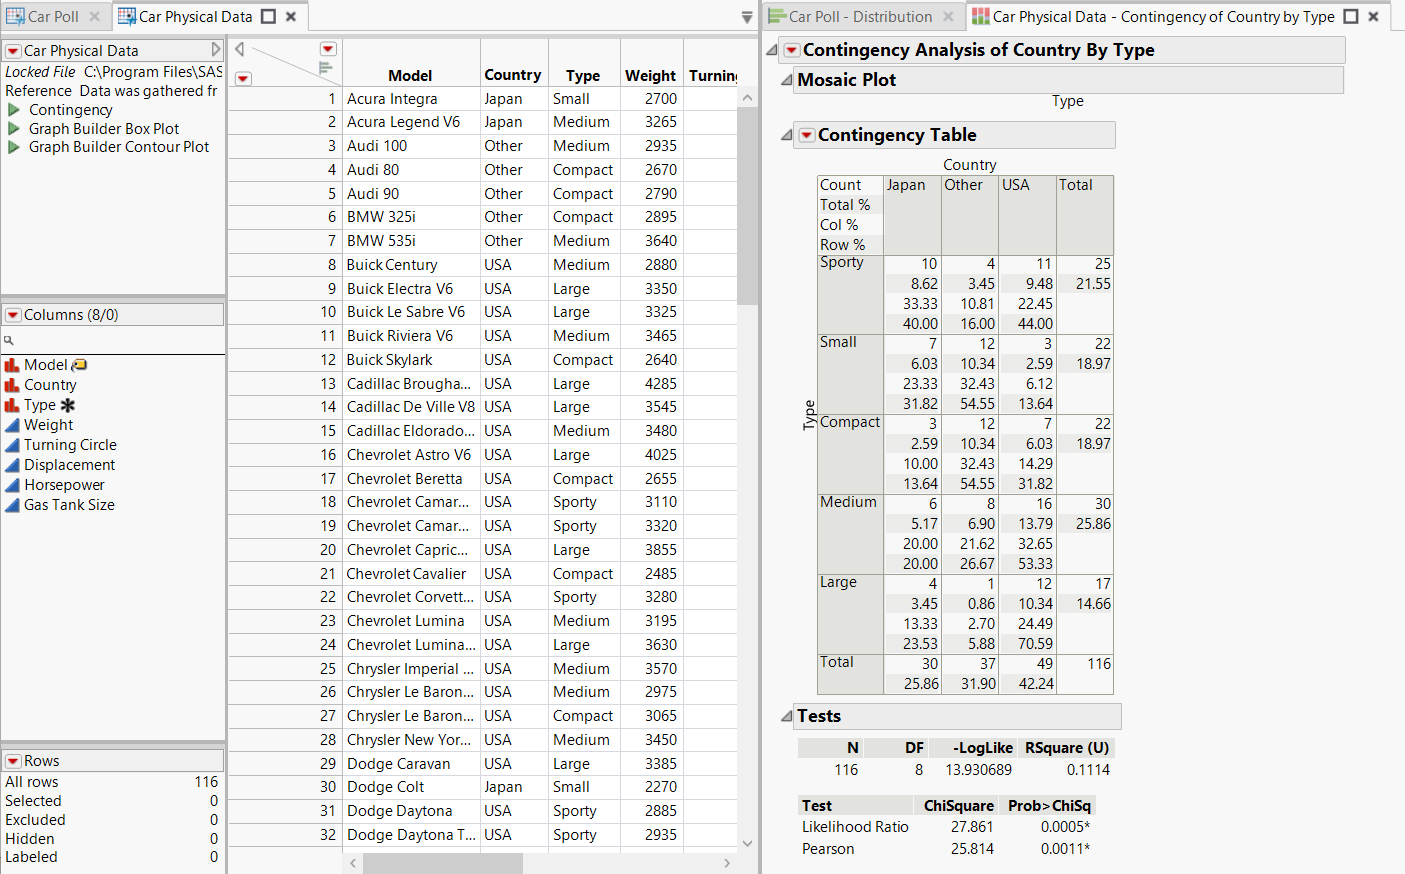
5. Drag the Car Poll - Distribution report tab to the right and drop it into the Dock right zone.
The Distribution report pane appears at the right of the project window. The report is docked and stays visible when you switch between tabs.
6. Drag the Car Physical Data - Contingency tab to the middle of the Car Poll - Distribution report and drop it into the Dock tab zone.
Tip: You can adjust the size of the data table window to fully show both reports.
7. Click the x to the right of Workspace, Contents, and Recent Files in the left column.
You can show these panes later by selecting the options in the Project menu.
Figure 7.4 Reports and Data Tables Grouped into Tabs
The Distribution and Contingency reports are now tabbed together, as are the two data tables.
