Statistical Details for Nonparametric Measures of Association
The Multivariate platform provides three nonparametric measures of association: Spearman, Kendall, or Hoeffding correlations. To calculate any of these correlations, the data are first ranked. Computations are then performed on the ranks of the data values. Average ranks are used in case of ties.
Note: When a Weight variable is specified, missing and zero-valued weights are excluded from the nonparametric correlation calculations. All other weight values are treated as 1.
Spearman’s ρ (rho) Coefficients
Spearman’s ρ correlation coefficient is computed on the ranks of the data using the formula for the Pearson’s correlation previously described.
Kendall’s τb Coefficients
Kendall’s τb coefficients are based on the number of concordant and discordant pairs. A pair of rows for two variables is concordant if they agree in which variable is greater. Otherwise, they are discordant, or tied.
The formula

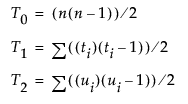
computes Kendall’s τb where:

Note the following:
• The sgn(z) is equal to 1 if z>0, 0 if z=0, and –1 if z<0.
• The ti (the ui) are the number of tied x (respectively y) values in the ith group of tied x (respectively y) values.
• The n is the number of observations.
• Kendall’s τb ranges from –1 to 1. If a weight variable is specified, it is ignored.
Computations proceed in the following way:
• Observations are ranked in order according to the value of the first variable.
• The observations are then re-ranked according to the values of the second variable.
• The number of interchanges of the first variable is used to compute Kendall’s τb.
Hoeffding’s D Statistic
The formula for Hoeffding’s D (1948) is

where:

Note the following:
• The Ri and Si are ranks of the x and y values.
• The Qi (sometimes called bivariate ranks) are one plus the number of points that have both x and y values less than the ith points.
• A point that is tied on its x value or y value, but not on both, contributes 1/2 to Qi if the other value is less than the corresponding value for the ith point. A point tied on both x and y contributes 1/4 to Qi.
When there are no ties among observations, the D statistic has values between –0.5 and 1, where 1 indicates complete dependence. If a weight variable is specified, it is ignored.