Publication date: 05/05/2023
The Bivariate Report
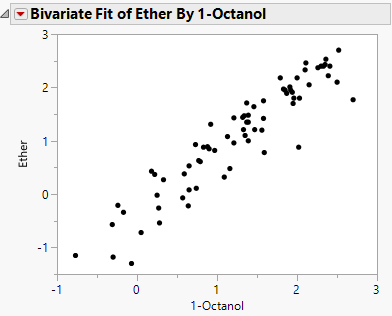
The Bivariate report initially contains a scatterplot for each pair of X and Y variables. You can fit models to the data and view statistical reports using the red triangle options. See Bivariate Platform Options.
Figure 5.4 The Bivariate Plot
Replace Variables Interactively
You can interactively replace variables in the plot by dragging and dropping a variable from one axis to the other axis. You can also replace a variable by selecting a variable in the Columns panel of the associated data table and dragging it onto an axis.
Want more information? Have questions? Get answers in the JMP User Community (community.jmp.com).
