Publication date: 05/05/2023
The Matched Pairs Report
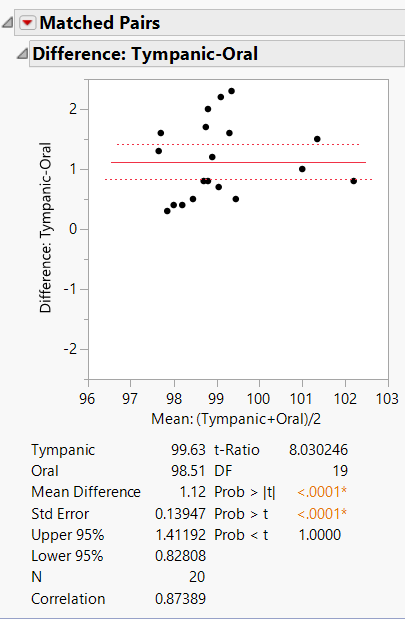
The Matched Pairs report shows a Tukey mean-difference plot, summary statistics, and the results of the paired t test. See Difference Plot and Report. If you specified an X, Grouping variable, the report also includes the Across Groups report. See Across Groups.
Figure 20.4 Example of Matched Pairs Report
Note: The red triangle menu provides additional options that can add reports to the initial report window. See Matched Pairs Platform Options.
Want more information? Have questions? Get answers in the JMP User Community (community.jmp.com).
