Build a Platform Preset
When you customize a report, you can save it as a Platform Preset so you can apply the same customizations to other data later. Platform Presets can be built using the wide variety of red triangle menu and formatting options.
This example does the following:
• Opens a data table
• Runs an analysis on that table, producing a report
• Applies red triangle menu options and format settings to create a customized report
• Saves the applied settings as a new Platform Preset
• Applies that Platform Preset to another data table
Build the Platform Preset
Begin by selecting Help > Sample Data Folder and open Cereal.jmp.
1. Select Analyze > Multivariate Methods > Multivariate.
2. Select the columns from Calories through Potassium, then select Y, Columns, and click OK.
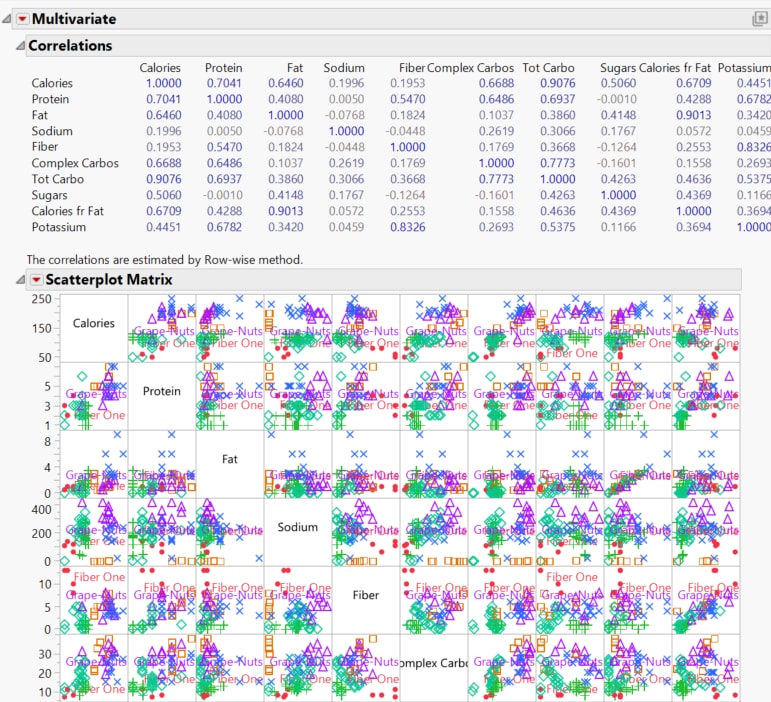
Figure 10.3 The Initial Multivariate Report Window
3. Select the Red Triangle menu on the Multivariate menu bar, then select Color Maps > Color Map on Spearman’s ρ.
4. Select the Red Triangle menu on the Multivariate menu bar again, then deselect Correlations Multivariate and Scatterplot Matrix.
5. Double-click the X Axis to open X Axis Settings, then select the Font... button.
6. In the Size setting of the Font window, select 14, and click OK.
7. Now back in the X Axis Settings, click OK to apply your changes.
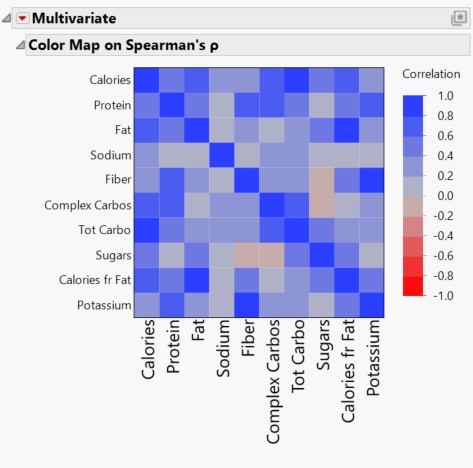
Figure 10.4 The Customized Report Window
8. To save the preset, click the Preset button ![]() in the Multivariate menu bar, then select Save Preset As...
in the Multivariate menu bar, then select Save Preset As...
9. In the Name: form enter the name Nonparametric Color Map, then click OK.
Reuse the Preset
Once you save this template, you can use it again on another data table of your choice. Begin by selecting Help > Sample Data Folder and open Candy Bars.jmp.
1. Select Analyze > Multivariate Methods > Multivariate.
2. Select the columns from Serving/pkg through Protein g, then select Y, Columns, and click OK.
3. Click the Preset button ![]() in the Multivariate menu bar, then select My Presets > Nonparametric Color Map to apply the saved Platform Preset.
in the Multivariate menu bar, then select My Presets > Nonparametric Color Map to apply the saved Platform Preset.
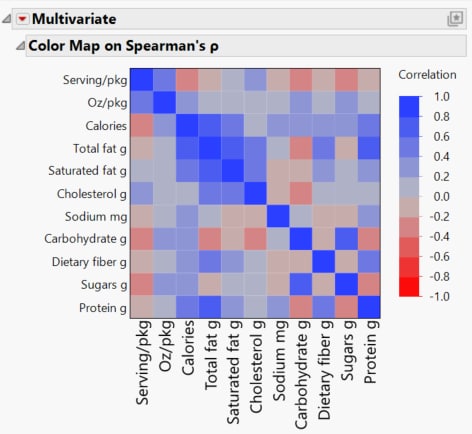
Figure 10.5 The Report Window with a Platform Preset Applied


