Characteristic Curves
In the Item Analysis report, the Characteristic Curves section contains an item characteristic curve (ICC) for each item that you specified in the launch window. The Characteristic Curves section is initially closed.
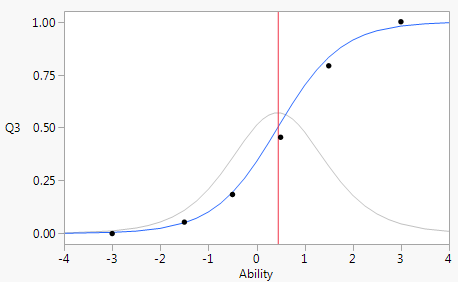
The item characteristic curve plots the probability of answering an item correctly versus ability. Ability is measured on a standardized scale, so a respondent with ability equal to 0 is a respondent of average ability. Data points for the observed probability of correct answers for fixed ability levels are plotted. Comparing the fitted characteristic curve to the data points provides a visual measure of goodness of fit of the model for each individual item. In addition, the characteristic plots have a background information curve and a vertical line at the characteristic curve inflection point. The background information curve is a plot of the slope of the item characteristic curve, which is maximized at the inflection point.
Figure 12.5 Item Characteristic Curve
Tip: You can adjust the number of characteristic curves that appear in each row of the report using the Number of Plots Across option in the Item Analysis red triangle menu.
