Example of a Boundary Map with Clipped Elements
Graphical elements (display segments such as reference, grid lines, and contours) can be clipped to conform to the boundaries of a geographical map. The Customize Graph window provides Clip Shape options, where you can select a boundary around which to clip the shape.
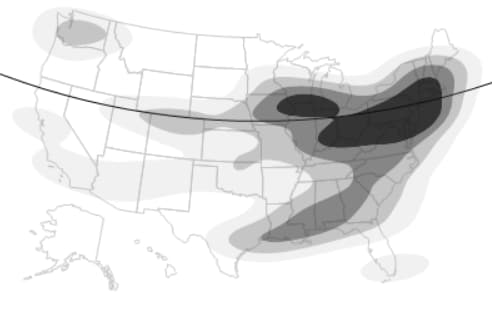
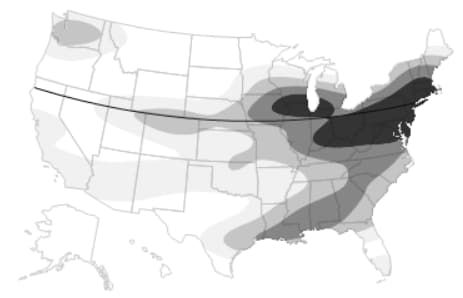
Figure 12.38 Unclipped (Left) and Clipped (Right) Reference Lines and Contours
Create the Background Map
1. Select Help > Sample Data Folder and open Cities.jmp.
2. Select Graph > Graph Builder.
3. Drag the Latitude column to the Y axis.
4. Drag the Longitude column to the X axis.
5. Right-click the graph and select Graph > Background Map.
6. In the Boundaries column, select US States and click OK.
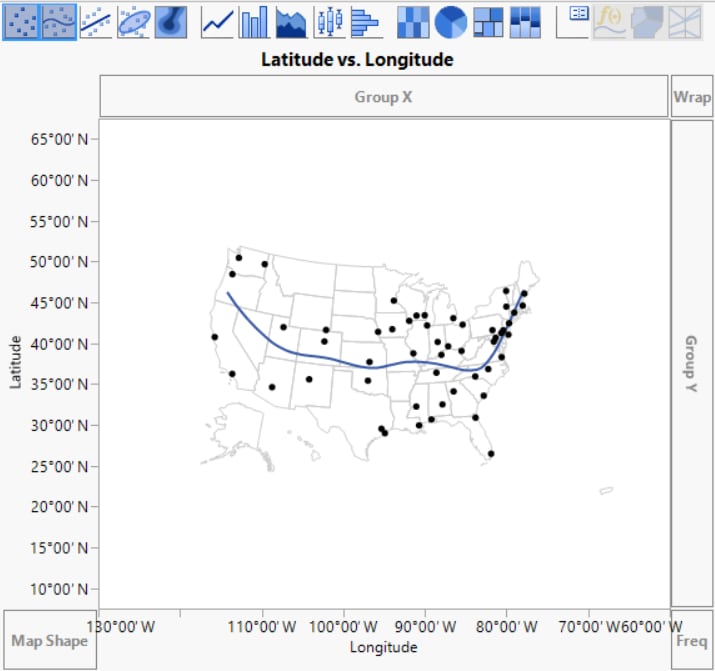
A map of the United States appears on the graph.
Figure 12.39 Background Map
7. Click the Points icon ![]() to remove the points.
to remove the points.
8. Click the Smoother icon ![]() to remove the smoother.
to remove the smoother.
9. Click the Contour icon ![]() .
.
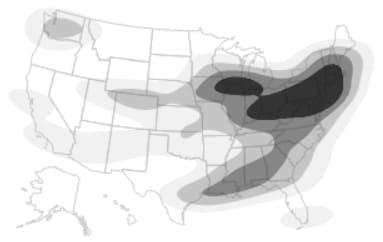
A contour plot appears on the map.
Figure 12.40 Unclipped Contours on Background Map
Add a Reference Line
1. On the Latitude axis, double-click 45° N to open the Y Axis Settings window.
2. In the Reference Lines pane, change the first number in the Value box to “40”.
For example, in 44°40.11′ N, change “44” to “40”.
3. Click Add and then OK.
Figure 12.41 Unclipped Reference Line
Assign a Clip Shape
1. Right-click the graph and select Customize.
2. Select Reference Lines and select US States from the Clip Shape list.
3. Select Contour, select US States from the Clip Shape list, and click OK.
Figure 12.42 Clipped Reference Line and Contours
Tips:
• The boundaries that appear in the Background Map window are installed in the JMP Maps installation folder. See Custom Map Files for more information about adding your own boundaries.
• Scripting provides additional options, such as specifying the clipping path in a matrix or string. See “Clip Display Segs in Graphics” in the Scripting Guide.


