Example of a Short Run Control Chart
In this example, you want to monitor the stability of a manufacturing process that produces two different products on the same manufacturing line. Each product run contains less than 25 samples. A Short Run Control Chart is appropriate for this type of data.
1. Select Help > Sample Data Folder and open Quality Control/Coating.jmp.
2. Select Analyze > Quality and Process > Control Chart Builder.
3. Drag Weight to the Y role.
4. In the drop-down list, select Short Run instead of Shewhart Variables.
5. Drag Product to the Part role.
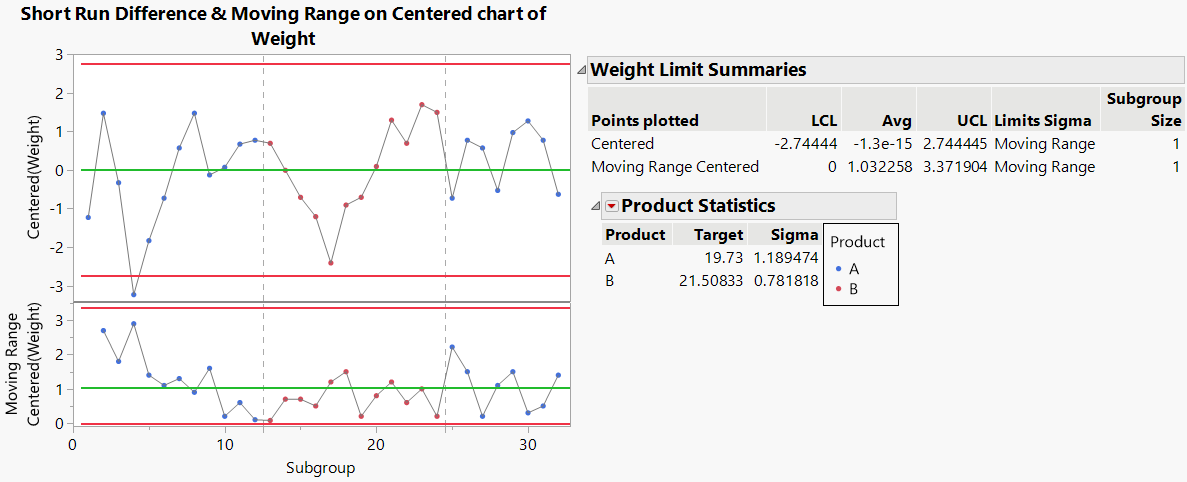
Figure 3.24 Short Run Control Chart
A Short Run Difference chart and Moving Range chart on the centered data are shown. The data points are colored by the product. There are dividers on the chart to show when production changed products. There is also a Product Statistics report that contains the target and sigma values for each product. The sigma value for Product A is 1.05 and the sigma value for Product B is 0.69. The sigma values do not differ by a large amount, so we can appropriately interpret the Short Run control chart. If the sigma values differed by a large amount, then a standardized chart could be considered. Product A had one point beyond the lower limit during the first run of that product.
