Example of a Simple Repeated Measures Model
Use the Standard Least Squares personality of the Fit Model platform to fit a model to repeated measures data. You want to analyze data on the distance traveled by each of six animals in each of the four seasons. There are two species and the animal identifier is nested within species. Since these six animals are representatives of larger species populations, you decide to treat subject as a random effect. You want to model the response, miles, as a function of species and season, accounting for the fact that there are repeated measures for each animal.
1. Select Help > Sample Data Folder and open Animals.jmp.
2. Select Analyze > Fit Model.
3. Select miles and click Y.
4. Select species and subject and click Add.
5. To nest subject within species: In the Construct Model Effects list, select subject. In the Select Columns list, select species. The two effects should be highlighted.
6. Click Nest.
7. In the Construct Model Effects list, select subject[species] and click Attributes > Random Effect.
8. In the Select Columns list, select season and click Add.
9. In the Construct Model Effects list, select season. In the Select Columns list, click species. Both effects should be highlighted.
10. Click Cross.
11. Click Run.
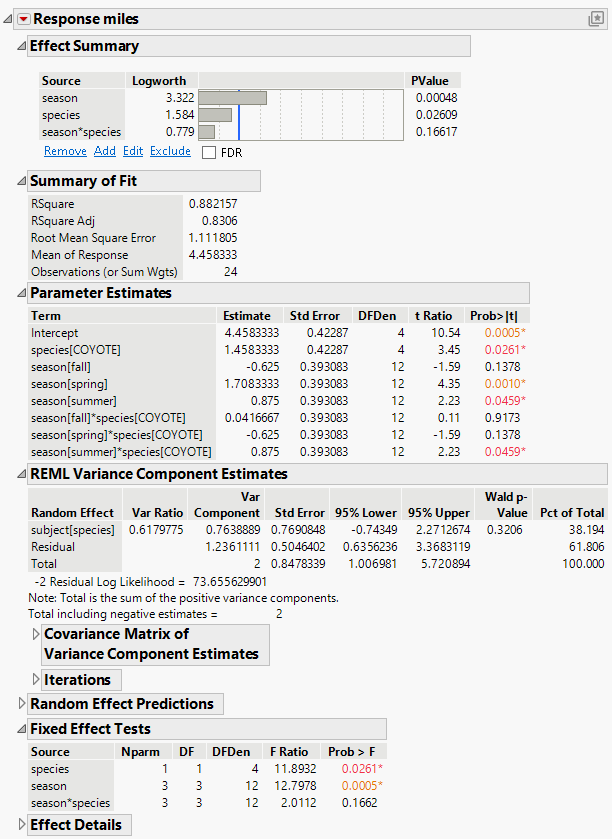
Figure 4.40 Partial Report of REML Analysis
The Effect Summary table indicates that both fixed effects, species and season, have a significant effect on the response variable miles. However, the interaction between season and species is not statistically significant. These results are also shown in the Fixed Effect Tests table.
The Parameter Estimates table indicates that the species[COYOTE], the season[spring], the season[summer], and the season[summer]*species[COYOTE] parameters have significant effects on miles, but the other variables and interactions are not statistically significant. The report also contains a REML Variance Component Estimates table for the random effects model that gives estimates of the subject within species and residual variances. Notice that the subject[species] random effect explains 38.194% of the total variance, and the residual component explains 61.806% of the total variance.
