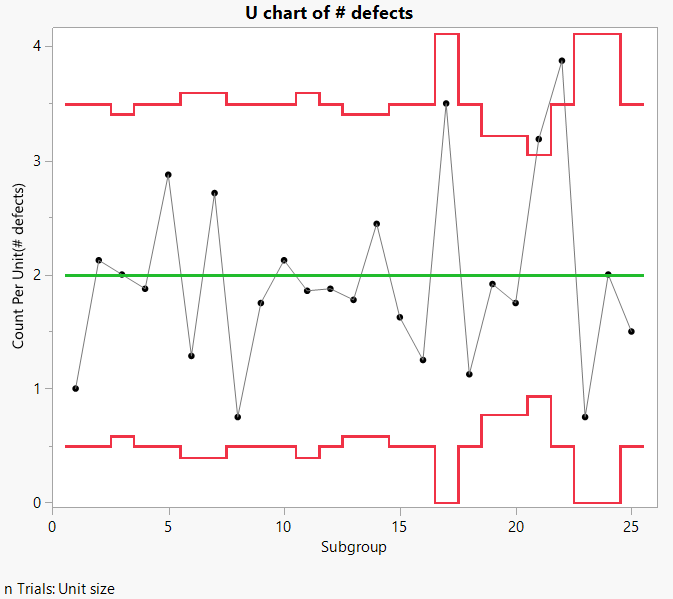
Example of a U Chart
In this example, you use the U Control Chart launch window to launch Control Chart Builder. You want to create a U chart to monitor the number of defects per subgroup sample size. The data are defect counts in boxes of automobile support braces. A box of braces constitutes one inspection unit. The number of boxes inspected (per day) is the subgroup sample size, which can vary.
1. Select Help > Sample Data Folder and open Quality Control/Braces.jmp.
2. Select Analyze > Quality and Process > Control Chart > U Control Chart.
3. Select # defects and click Y, n Defects.
4. Select Unit size and click n Trials.
5. Click OK.
Figure 3.33 U chart of # Defects
Because the sample sizes are not equal across subgroups, the limits are uneven. Two of the last five samples are not within the control limits.
