Example of Aligned Responses
Use the Categorical platform to explore a number of survey questions that all have the same set of responses.
1. Select Help > Sample Data Folder and open Consumer Preferences.jmp.
2. Scroll to see the column I am working on my career.
Figure 3.29 Consumer Preferences Data Table (Partial Table)
Note that there are six columns, all with the same responses: Agree and Disagree. The responses for these six columns are aligned. For this example, analyze the columns I am working on my career and I want to see the world. First, use standardize attributes to set the value colors, value order, and modeling type for these two columns:
3. Select the column headings I am working on my career and I want to see the world. Right-click and select Standardize Attributes.
4. Select Column Properties > Value Colors. Right-click the Agree color oval and set it to green and set Disagree to red.
5. Select Column Properties > Value Order. Click Reverse.
6. Select Attributes > Modeling Type and Modeling Type > Ordinal.
7. Click OK.
Next, use the Categorical platform to analyze these two columns.
8. Select Analyze > Consumer Research > Categorical.
9. Select I am working on my career and I want to see the world.
10. Select the Related tab, and then click Aligned Responses on the Related tab.
Tip: To do the same thing using the Structured tab, drag the two columns into the Multiple Aligned drop zone (green arrow).
11. Click OK.
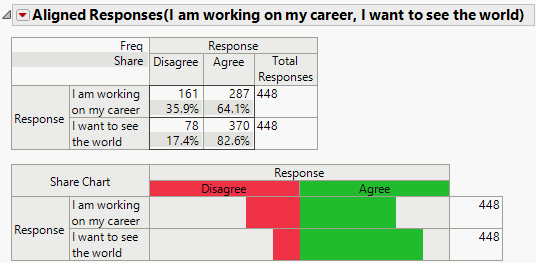
Figure 3.30 Aligned Response Report
Notice that the Share Chart is a directional bar chart. The type of bar chart you see depends on the modeling type of the columns:
• Ordinal columns result in a directional bar chart. The columns in this example are both ordinal.
• Nominal columns result in a stacked bar chart.

