Example of an LSMeans Contrast
Use the Standard Least Squares personality of the Fit Model platform to fit a linear regression model and then to explore a least squares means (LSMeans) contrast. Use a LSMeans contrast to compare the weight of children in different age groups.
1. Select Help > Sample Data Folder and open Big Class.jmp.
2. Select Analyze > Fit Model.
3. Select weight and click Y.
4. Select age, sex, and height, and click Add.
5. Select age in the Select Columns list, select height in the Construct Model Effects list, and click Cross.
6. Click Run.
The Fit Least Squares report appears.
7. Click the age red triangle and select LSMeans Contrast.
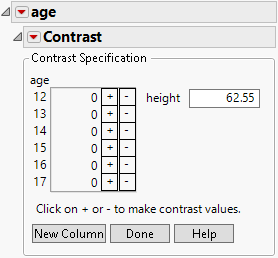
Figure 4.43 LSMeans Contrast Specification for age
8. Click “+” for the ages 12 and 13.
9. Click “-” for ages 14 and 15.
This contrast tests whether the mean weights differ for the two age groups, based on predicted values at a height of 62.55.
10. Note that there is a text box next to the continuous effect height. The default value is the mean of the continuous effect.
11. Click Done.
12. Open the Test Detail and Parameter Function reports.
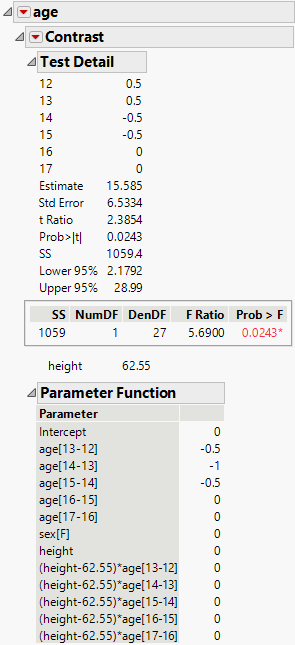
Figure 4.44 LSMeans Contrast Report
The Contrast report shows that the test for the contrast has a p-value of 0.0243, which is significant at the 0.05 level. You conclude that the predicted weight for age 12 and 13 children differs statistically from the predicted weight for age 14 and 15 children at the mean height of 62.55.

