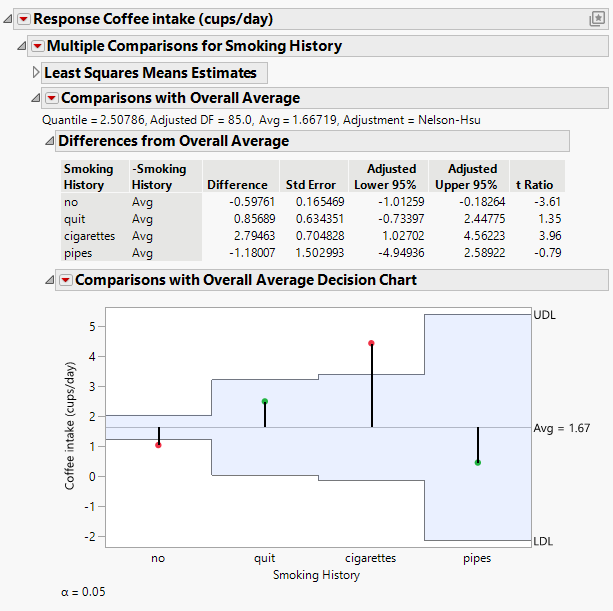
Example of Comparisons with Overall Average
Use the Standard Least Squares personality of the Fit Model platform to fit a linear regression model and then use analysis of means (ANOM) to investigate the effect of a categorical predictor on the response while controlling for additional factors.
In this example, you are interested in whether the mean Coffee intake (cups/day) differs for subjects in any of the four Smoking History categories compared to the overall average coffee intake while controlling for alcohol use and heart history.
1. Select Help > Sample Data Folder and open Lipid Data.jmp.
2. Select Analyze > Fit Model.
3. Select Coffee intake (cups/day) and click Y.
4. Select Smoking History, Alcohol Use, and Heart History, and click Add.
5. Click Run.
6. Click the red triangle next to Response Coffee intake (cups/day) and select Multiple Comparisons.
7. From the Choose an Effect list, select Smoking History.
8. In the Choose Initial Comparisons list, select Comparisons with Overall Average - ANOM.
9. Click OK.
Figure 4.45 Comparisons with Overall Average for Ratings
The results in the Comparisons with Overall Average report indicate that the least squares means for non-smokers and cigarette smokers differ significantly from the overall average in terms of coffee intake.
