Publication date: 02/06/2025
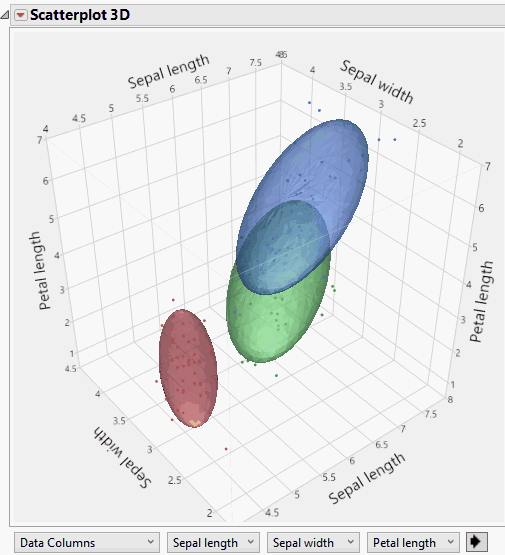
Example of Grouped Normal Contour Ellipsoids
This example shows how to group measurements by species and to format each group with a normal contour ellipsoid in a 3D scatterplot. The ellipsoids cover 75% of the data points and are 50% transparent. The contours are color-coded (using JMP default colors) based on species.
1. Select Help > Sample Data Folder and open Iris.jmp.
2. Select Graph > Scatterplot 3D.
3. Select Sepal length, Sepal width, Petal length, and Petal width and click Y, Columns.
4. Click OK.
5. Click the Scatterplot 3D red triangle and select Normal Contour Ellipsoids.
6. Select Grouped by Column.
7. Select Species.
8. Type 0.75 next to Coverage.
9. Type 0.5 next to Transparency.
10. Click OK.
Figure 9.9 Example of Grouped Normal Contour Ellipsoids
Want more information? Have questions? Get answers in the JMP User Community (community.jmp.com).
