 Example of Model Comparison
This example compares a regression model and a bootstrap forest model. The data consist of important parameters, suppliers, measurements, and quality indicators related to the tablet production process. The goal is to build a model for dissolution rate.
Begin by selecting Help > Sample Data Folder and opening Tablet Production.jmp.
Create a Validation Column
1. Select Analyze > Predictive Modeling > Make Validation Column.
2. Do not select any columns in the launch window.
This indicates that the platform will create a simple random validation column
3. Click OK.
4. In the box next to New Column Name, type Create Validation.
5. In the box next to Random Seed, enter 1234.
6. Click Go.
A new Validation column is created. The rows assigned Training are in the training set. The rows assigned Validation are in the validation set.
Create the Regression Model and Save the Prediction Formula to a Column
1. Select Analyze > Fit Model.
2. Select Dissolution and click Y.
3. Select API Particle Size through Lot Acceptance and click Add.
Note: Do not include Dissolution in this selection.
4. Select Create Validation and click Validation.
5. Select Stepwise in the Personality list.
6. Click the Run button.
7. Select P-value Threshold from the Stopping Rule list.
8. Click the Go button.
9. Click the Run Model button.
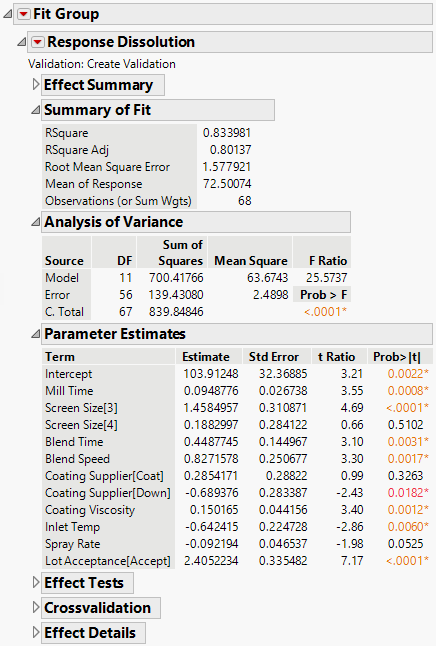
Figure 11.2 Fit Model Report
10. To save the prediction formula to a column, click the Response Dissolution red triangle and select Save Columns > Prediction Formula.
Create the Bootstrap Forest Model and Save the Prediction Formula to a Column
1. Select Analyze > Predictive Modeling > Bootstrap Forest.
2. Select Dissolution and click Y, Response.
3. Select API Particle Size through Lot Acceptance and click X, Factor.
Note: Do not include Dissolution in this selection.
4. Select Create Validation and click Validation.
5. Click OK.
6. Enter 617 in the box next to Random Seed.
7. Click OK.
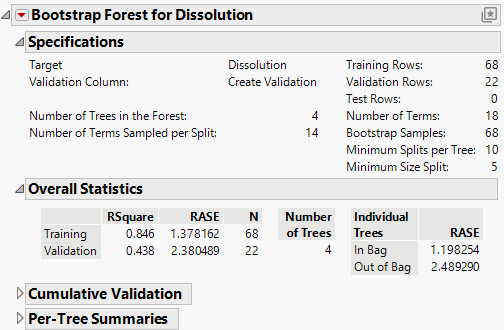
Figure 11.3 Bootstrap Forest Model
8. To save the prediction formula to a column, click the Bootstrap Forest for Dissolution red triangle and select Save Columns > Save Prediction Formula.
Compare the Models
1. Select Analyze > Predictive Modeling > Model Comparison.
2. Select the two prediction formula columns and click Y, Predictors.
3. Select Create Validation and click Group.
Tip: If a Group column is not specified, JMP automatically recognizes when the same validation column has been used for all predictors and prompts you to add it as a grouping variable.
4. Click OK.
Figure 11.4 Model Comparison Report
The rows in the training set were used to build the models, so the RSquare statistics for Create Validation = Training might be artificially inflated. In this case, the statistics are not representative of the models’ future predictive ability. This is especially true for the bootstrap forest model. Compare the models using the statistics for Create Validation = Validation. In this case, the validation RSquare statistics for the models are almost equivalent (0.434 and 0.438). Both the bootstrap forest model and the regression model have reasonable predictive capabilities.
5. Click the Model Comparison red triangle and select Profiler.
Figure 11.5 Prediction Profiler for All Models
The prediction profiler enables you to compare the impact of each factor in the different models. The profiler is especially interesting when comparing different types of models such as here where you have a regression model and a partition model.
• “Model Specification” in Fitting Linear Models


