Example of Process History Explorer
Use Process History Explorer to investigate the yields of wafers that have gone through a complex manufacturing process.
1. Select Help > Sample Data Folder and open Quality Control > Lot Wafer History.jmp and Quality Control > Lot Wafer Yield.jmp.
Lot Wafer History.jmp contains step-by-step history of 25 wafers in 50 lots. Lot Wafer Yield.jmp contains the yield for each wafer in each lot.
2. From the Lot Wafer History.jmp data table, select Analyze > Screening > Process History Explorer.
3. Select Lot and Wafer and click ID.
4. Select Tool and Route and click X, Process.
5. Select Layer and Operation and click Step.
6. Select TimeIn and TimeOut and click Timestamp.
7. Click OK.
A window appears that enables you to select the corresponding yield table.
8. Select Lot Wafer Yield and click OK.
A window appears that enables you to select the yield column.
9. Select Yield and click OK.
10. Click the Process History Explorer red triangle and select Levels with Lowest Yield.
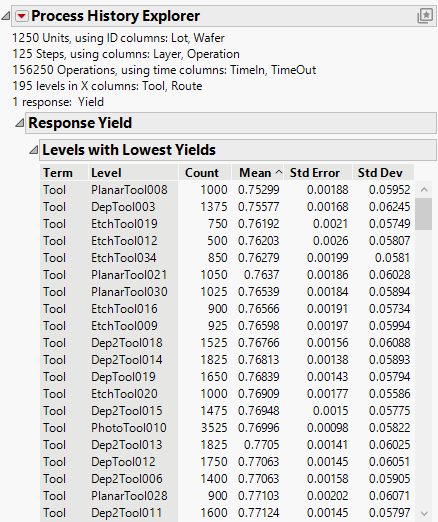
Figure 27.2 Process History Explorer Report
The report contains information about the process, including the number of units, steps, operations, and levels in the X columns. The Levels with Lowest Yields table contains counts and yield information for the 195 levels in the X columns. Notice that the PlanarTool008 tool had the lowest yield and 1,000 units went through that tool.
