Example of Supercategories
This example illustrates the use of combining survey response categories into supercategories to use in the Categorical platform.
1. Select Help > Sample Data Folder and open Color Preference Survey.jmp.
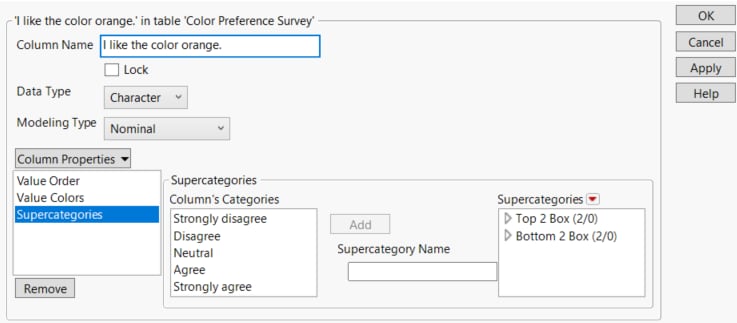
2. Select the column I like the color orange. Right-click the column heading and select Column Properties > Supercategories.
3. Under Supercategories, select Agree and Strongly agree for the column’s categories.
4. Under Supercategory Name, enter Top 2 Box.
5. Click Add.
Tip: Click on the triangle to the left of the name to show the categories included in the supercategory.
6. Under Supercategories, select Disagree and Strongly disagree for the column’s categories.
7. Under Supercategory Name, enter Bottom 2 Box.
8. Click Add.
Figure 3.22 Supercategory Column Property
9. Click OK.
10. Select Analyze > Consumer Research > Categorical.
11. Select the Structured tab.
12. Click the Side green triangle and select I like the color orange.
13. Click the Top green triangle and select What is your gender?
14. Click Add=> and click OK.
15. Click the Categorical red triangle and select Transposed Freq Chart.
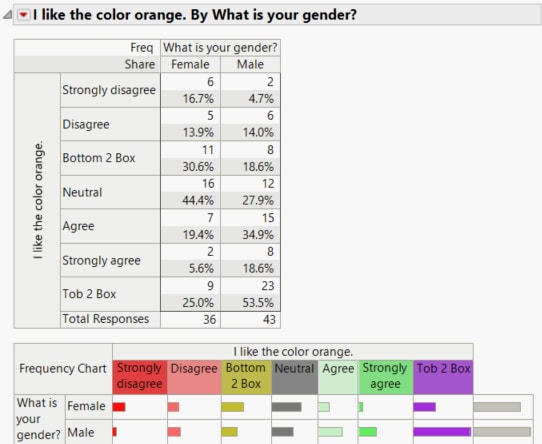
Figure 3.23 Structured Categorical Report with Supercategories
The crosstab table includes two additional rows, one for each supercategory. The supercategories are also included in the Frequency Chart. Note that the frequency counts in the Top 2 Box row are the sums of the counts in the Agree and Strongly agree categories. The frequency counts in the Bottom 2 Box row are the sums of the counts in the Disagree and Strongly disagree categories.
16. Click the Categorical red triangle and deselect Response Levels.
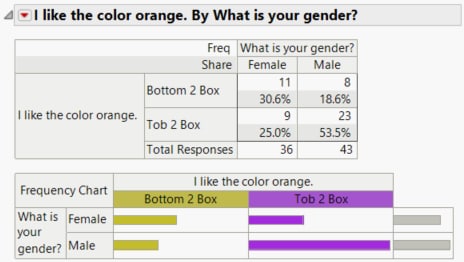
Figure 3.24 Structured Categorical Report with Supercategories and No Response Levels
By removing the response levels, your output now contains only the supercategories. Note that the totals are for all levels. In this example, the neutral responses are not included in the supercategories.


